
You Might Like
-

Brown Mat for Home -
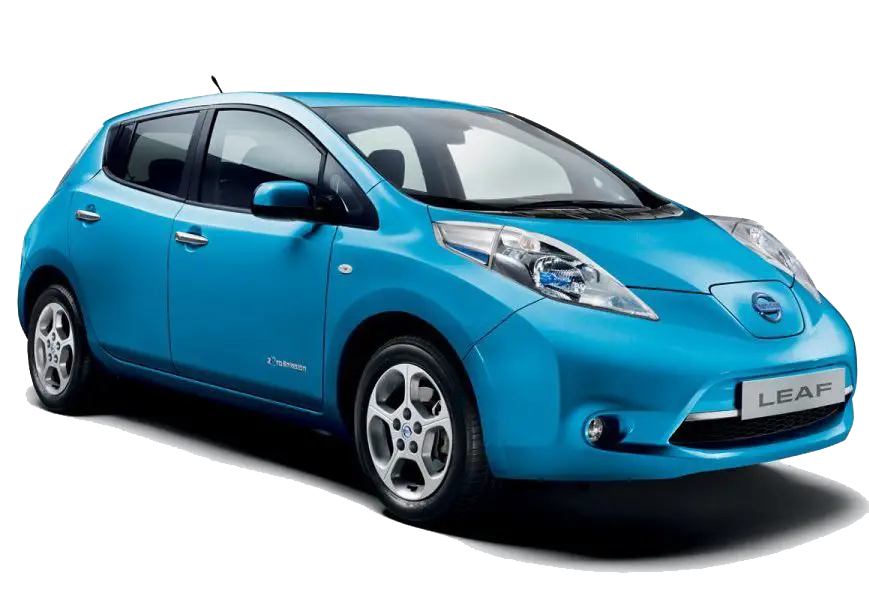
Blue Eco-Friendly Electric Car -

Green Leafy Frame -

Shiny Red Heart for Valentine's Day -

Blue Cartoon Character with Attitude -

Fresh Coconut Halves for Tropical Essence -

Green Train Cartoon Illustration -

Red Heart with Valentine's Day Message -

Blue Play Button Icon -
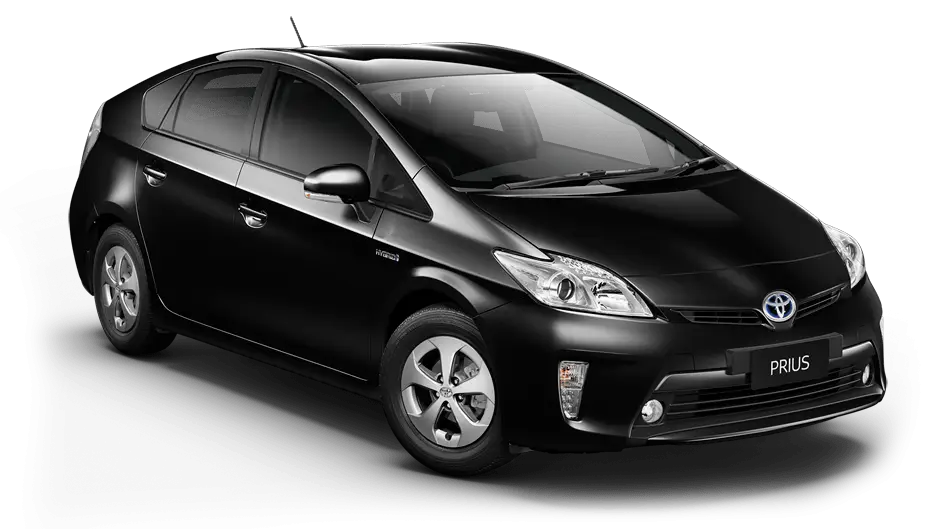
Modern Black Sedan Car for Urban Driving -

Comfortable Pillows for a Good Sleep -

Red and Gold Christmas Ornament -

Cute Cartoon Dolphin Illustration -

Bright Corn Cob Illustration -

Green Aloe Vera in Ceramic Pot -

Blue Down Left Arrow Traffic Sign -

Park Bench with Lamp Post and Trees in the Background -

Beautiful Nature Scene with Lake and Forest -

Butterflies Flying Over Lush Green Grass -

Beautiful Red Tulips Illustration -

Blue Microsoft Edge Logo -

Green Four-Leaf Clover Illustration -

Cool Skateboard Deck -

Red Race Car Cake -

Team with Growth Graph Illustration -

Lush Green Tree Illustration -

Blue Game Controller Icon -

Succulent Plant Close-Up Illustration -

Retro Red Alarm Clock -

Wooden Treehouse in Forest Illustration