
You Might Like
-
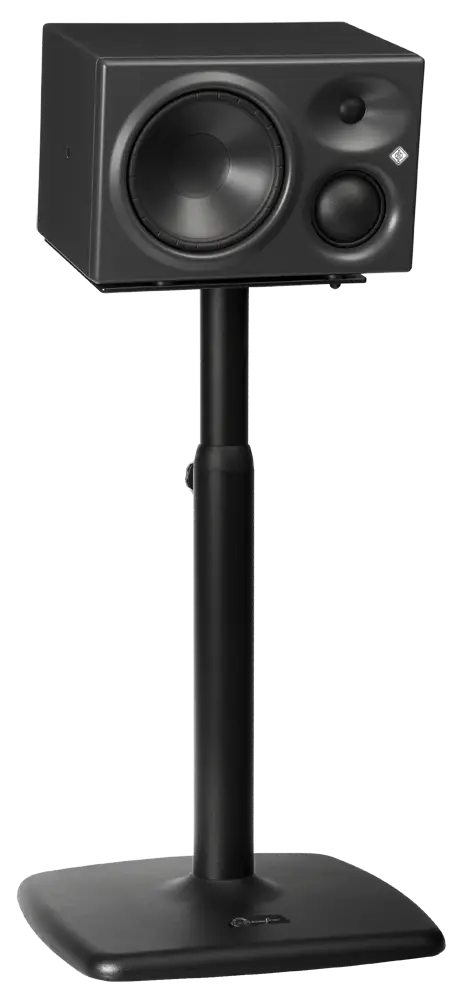
Black Speaker Mounted on a Stand -

Team with Growth Graph Illustration -
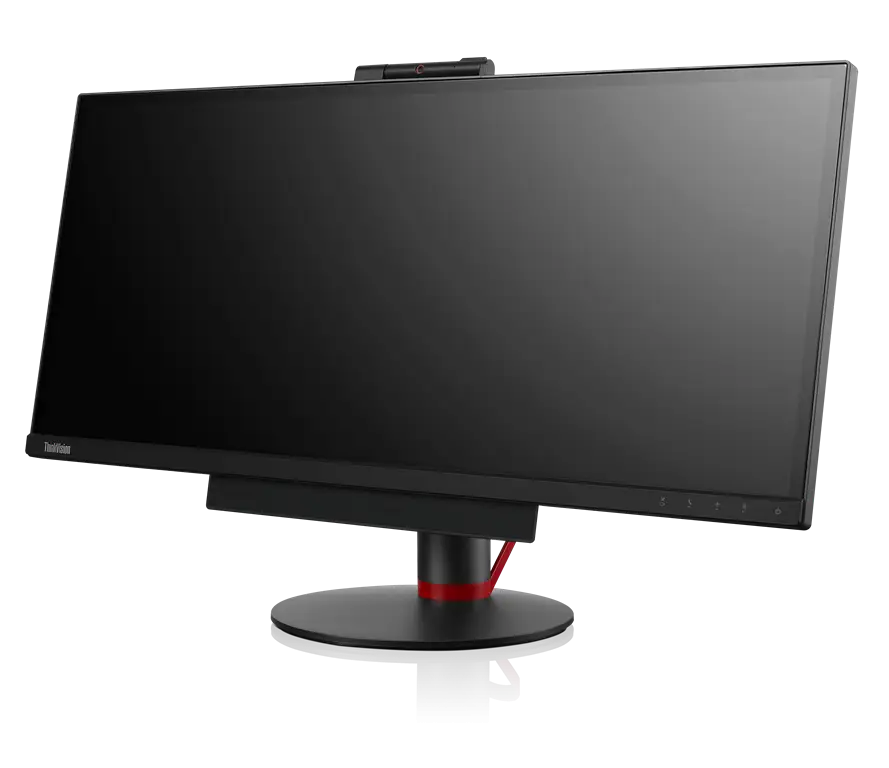
Modern Ultrawide Computer Monitor Display -

Business Strategy Icons -

Various Devices Displaying Software -

Icon of KPI Dashboard with Graph and Person -

Zigzag Down Arrow Icon for Decline Representation -

Presentation Board with Graph for Business Concepts -

Bar Chart with Upward Arrow -

Infographic Pencil with Data Elements -

Search Growth Icon -

Illustration of Growth Chart with Upward Arrow -
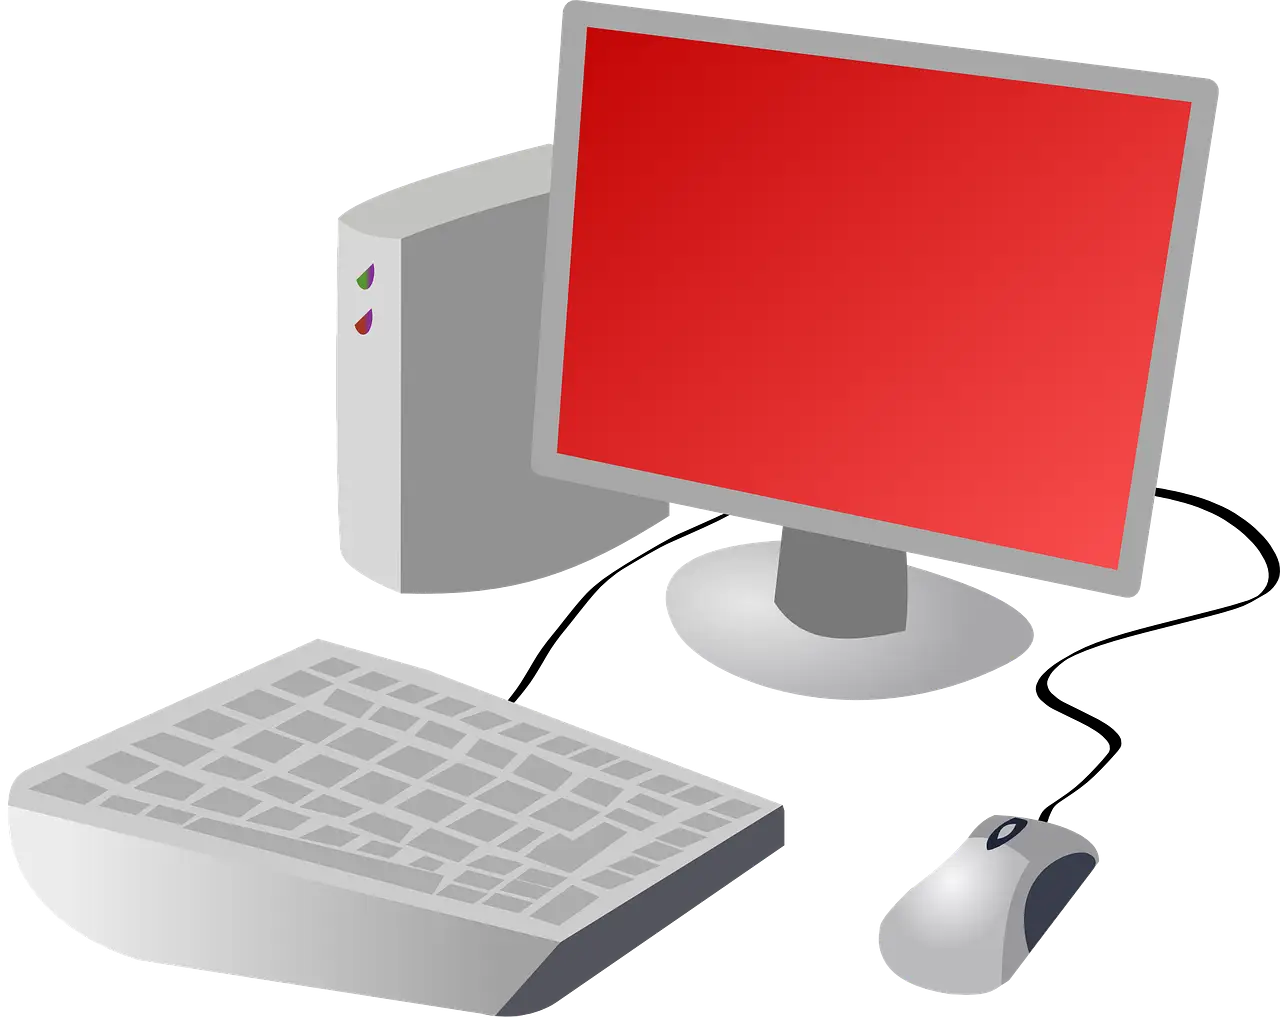
Desktop Computer Set with Red Screen -
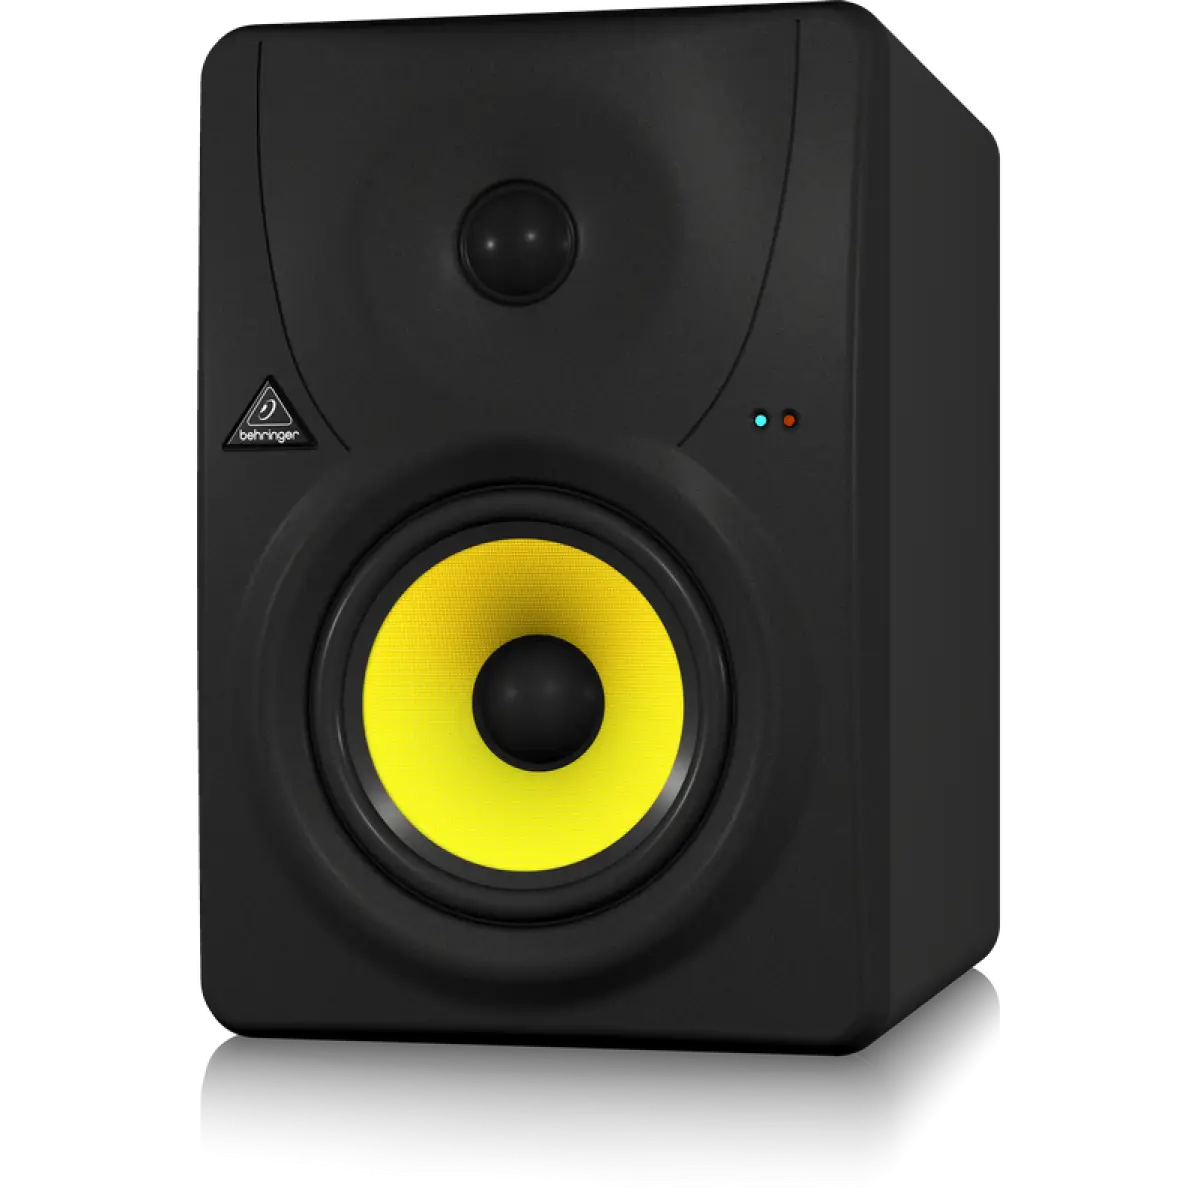
Black Speaker with Vibrant Yellow Cone -

SEO Concept with Magnifying Glass and Computer -
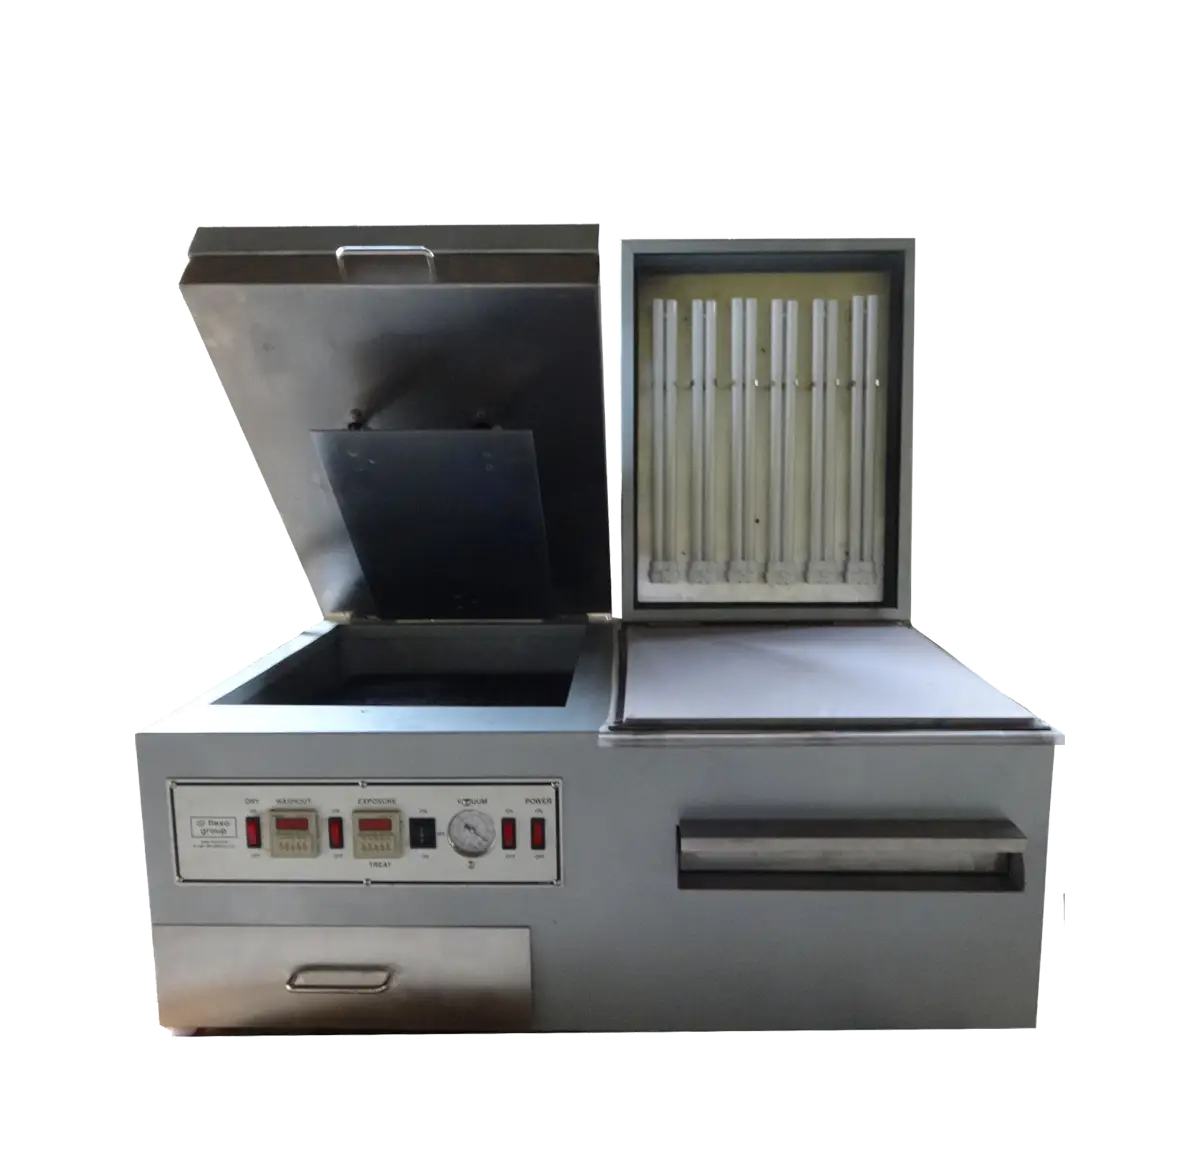
Industrial Machine for Manufacturing -

Blue Declining Bar Graph with Arrow -

Business Icons Set for Digital Workflows -

Circle Pie Chart Icon -

Desktop Computer with Tower Illustration -

Declining Chart Illustration -

Light Bulb with Globe and Analytics -

34,046 CPS Appointments Text -

Pie Chart Representation -

Industrial Factory Logo with Flame -

Digital Devices with Graph -

Clipboard Illustration with Financial Chart for Data Analysis -

Black Gear Mechanisms Symbol -

Magnifying Glass with Graph Illustration -
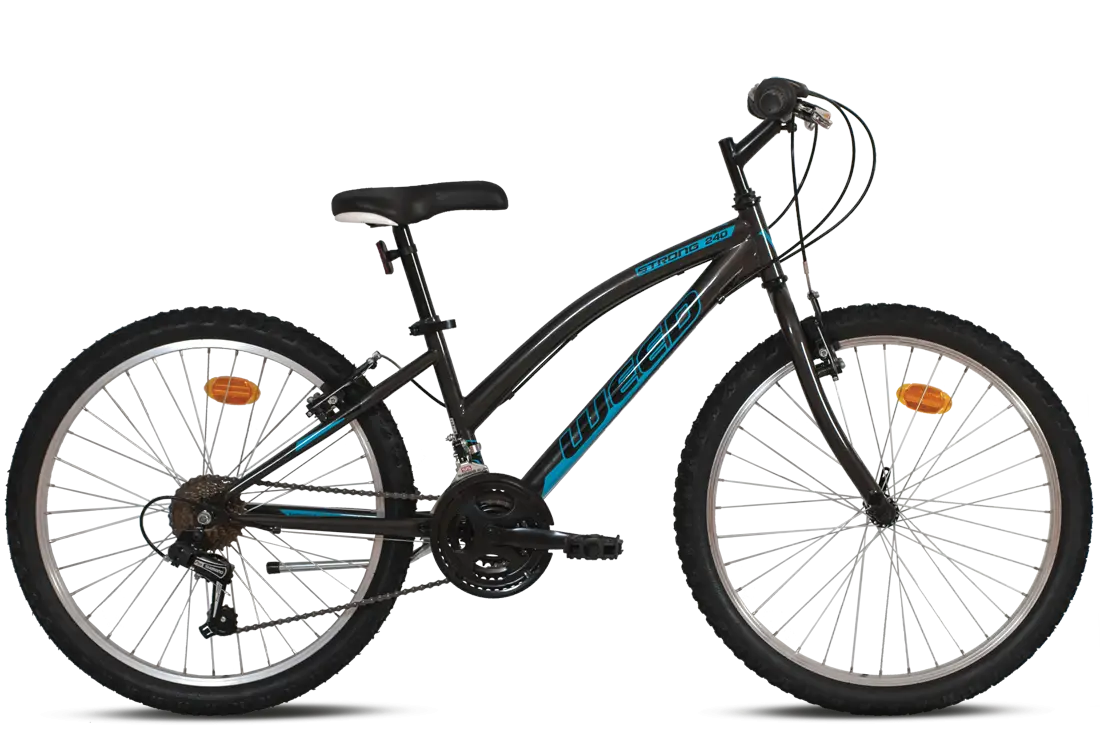
Durable Black Mountain Bicycle for Outdoor Adventures