
You Might Like
-

Chemical Molecule Structure Illustration -

Team with Growth Graph Illustration -

Business Strategy Icons -

Red Virus Illustration Representing Pathogen -

Various Devices Displaying Software -

Icon of KPI Dashboard with Graph and Person -

Zigzag Down Arrow Icon for Decline Representation -

Magnifying Glass with Blue Lens -

Presentation Board with Graph for Business Concepts -

Modern Astronomy Telescope with Mount -

Bar Chart with Upward Arrow -

Infographic Pencil with Data Elements -
Black Microscope Illustration -

Search Growth Icon -

Illustration of Growth Chart with Upward Arrow -

Precision Hardness Tester for Materials -

Mouse with Magnifying Glass Cartoon -
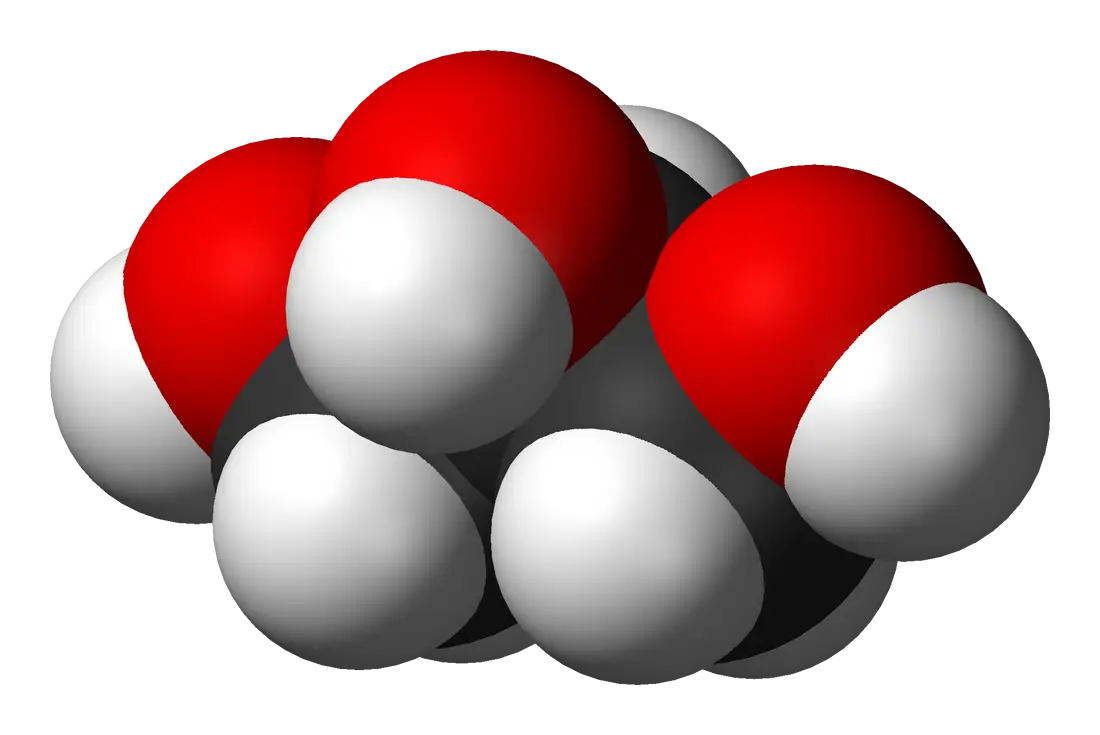
Molecule Structure Scientific Model -
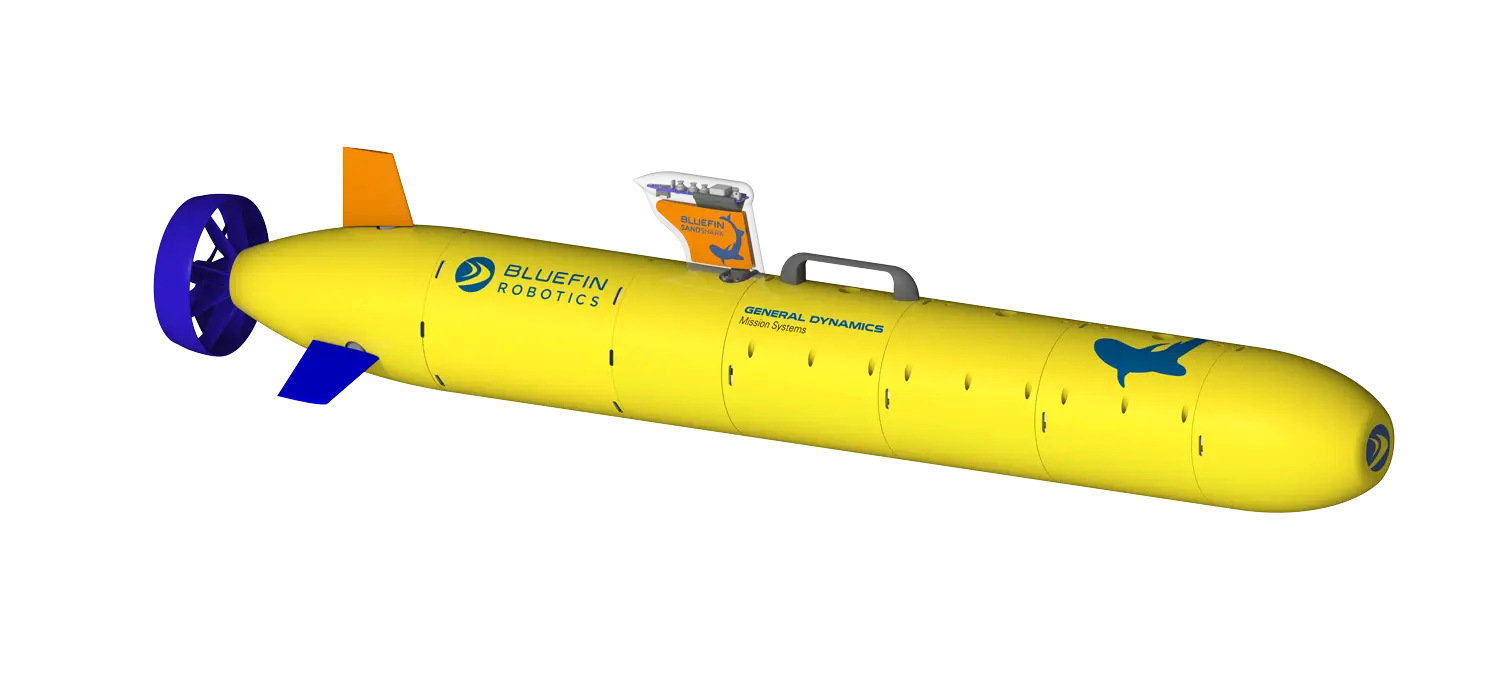
Yellow Submarine for Ocean Exploration -

SEO Concept with Magnifying Glass and Computer -

Chemical Structure Illustration for Scientific Study -

Blue Declining Bar Graph with Arrow -

Business Icons Set for Digital Workflows -

Circle Pie Chart Icon -
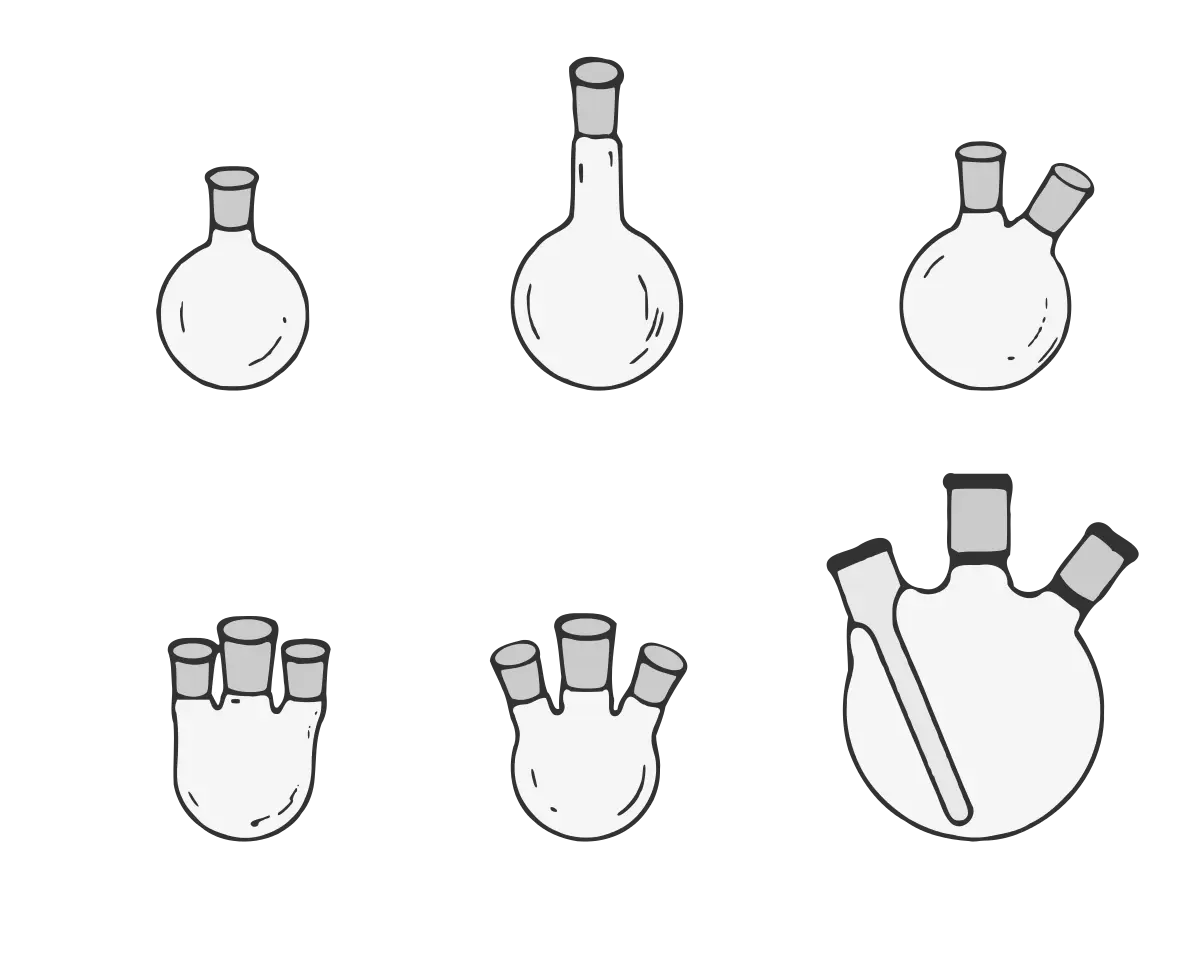
Various Laboratory Flasks -

Declining Chart Illustration -

Eco-Friendly Science Flask Icon -

Light Bulb with Globe and Analytics -

Round-Bottom Flask with Green Liquid -
34,046 CPS Appointments Text