
Glycolysis Pathway Diagram
Here's a detailed diagram outlining the glycolysis pathway, a central process in metabolism where glucose is broken down. You can trace the journey of a six-carbon sugar as it transforms through multiple steps, eventually yielding two three-carbon molecules. The diagram highlights critical energy transactions, showing where ATP is consumed to prime the molecule and where it's generated, along with the reduction of NAD+ to NADH. It's a clear visual guide to understanding the biochemical sequence and energy dynamics of this essential cellular process.
glycolysis - metabolism - glucose - ATP - NADH - biochemical pathway - cellular respiration
This image only for personal use, png & jpg filesize may vary
You Might Like
-
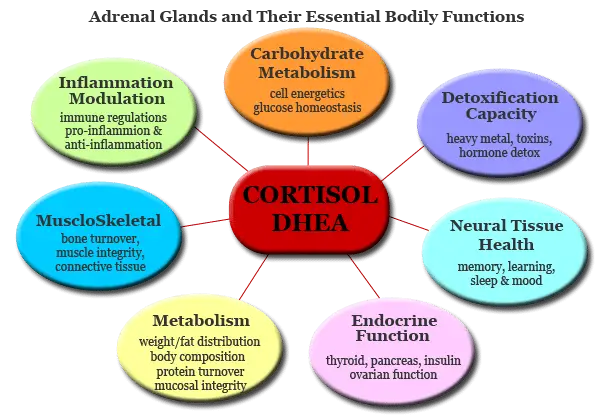
Cortisol DHEA Functions Diagram -
Blood Glucose Meter in Flat Style -
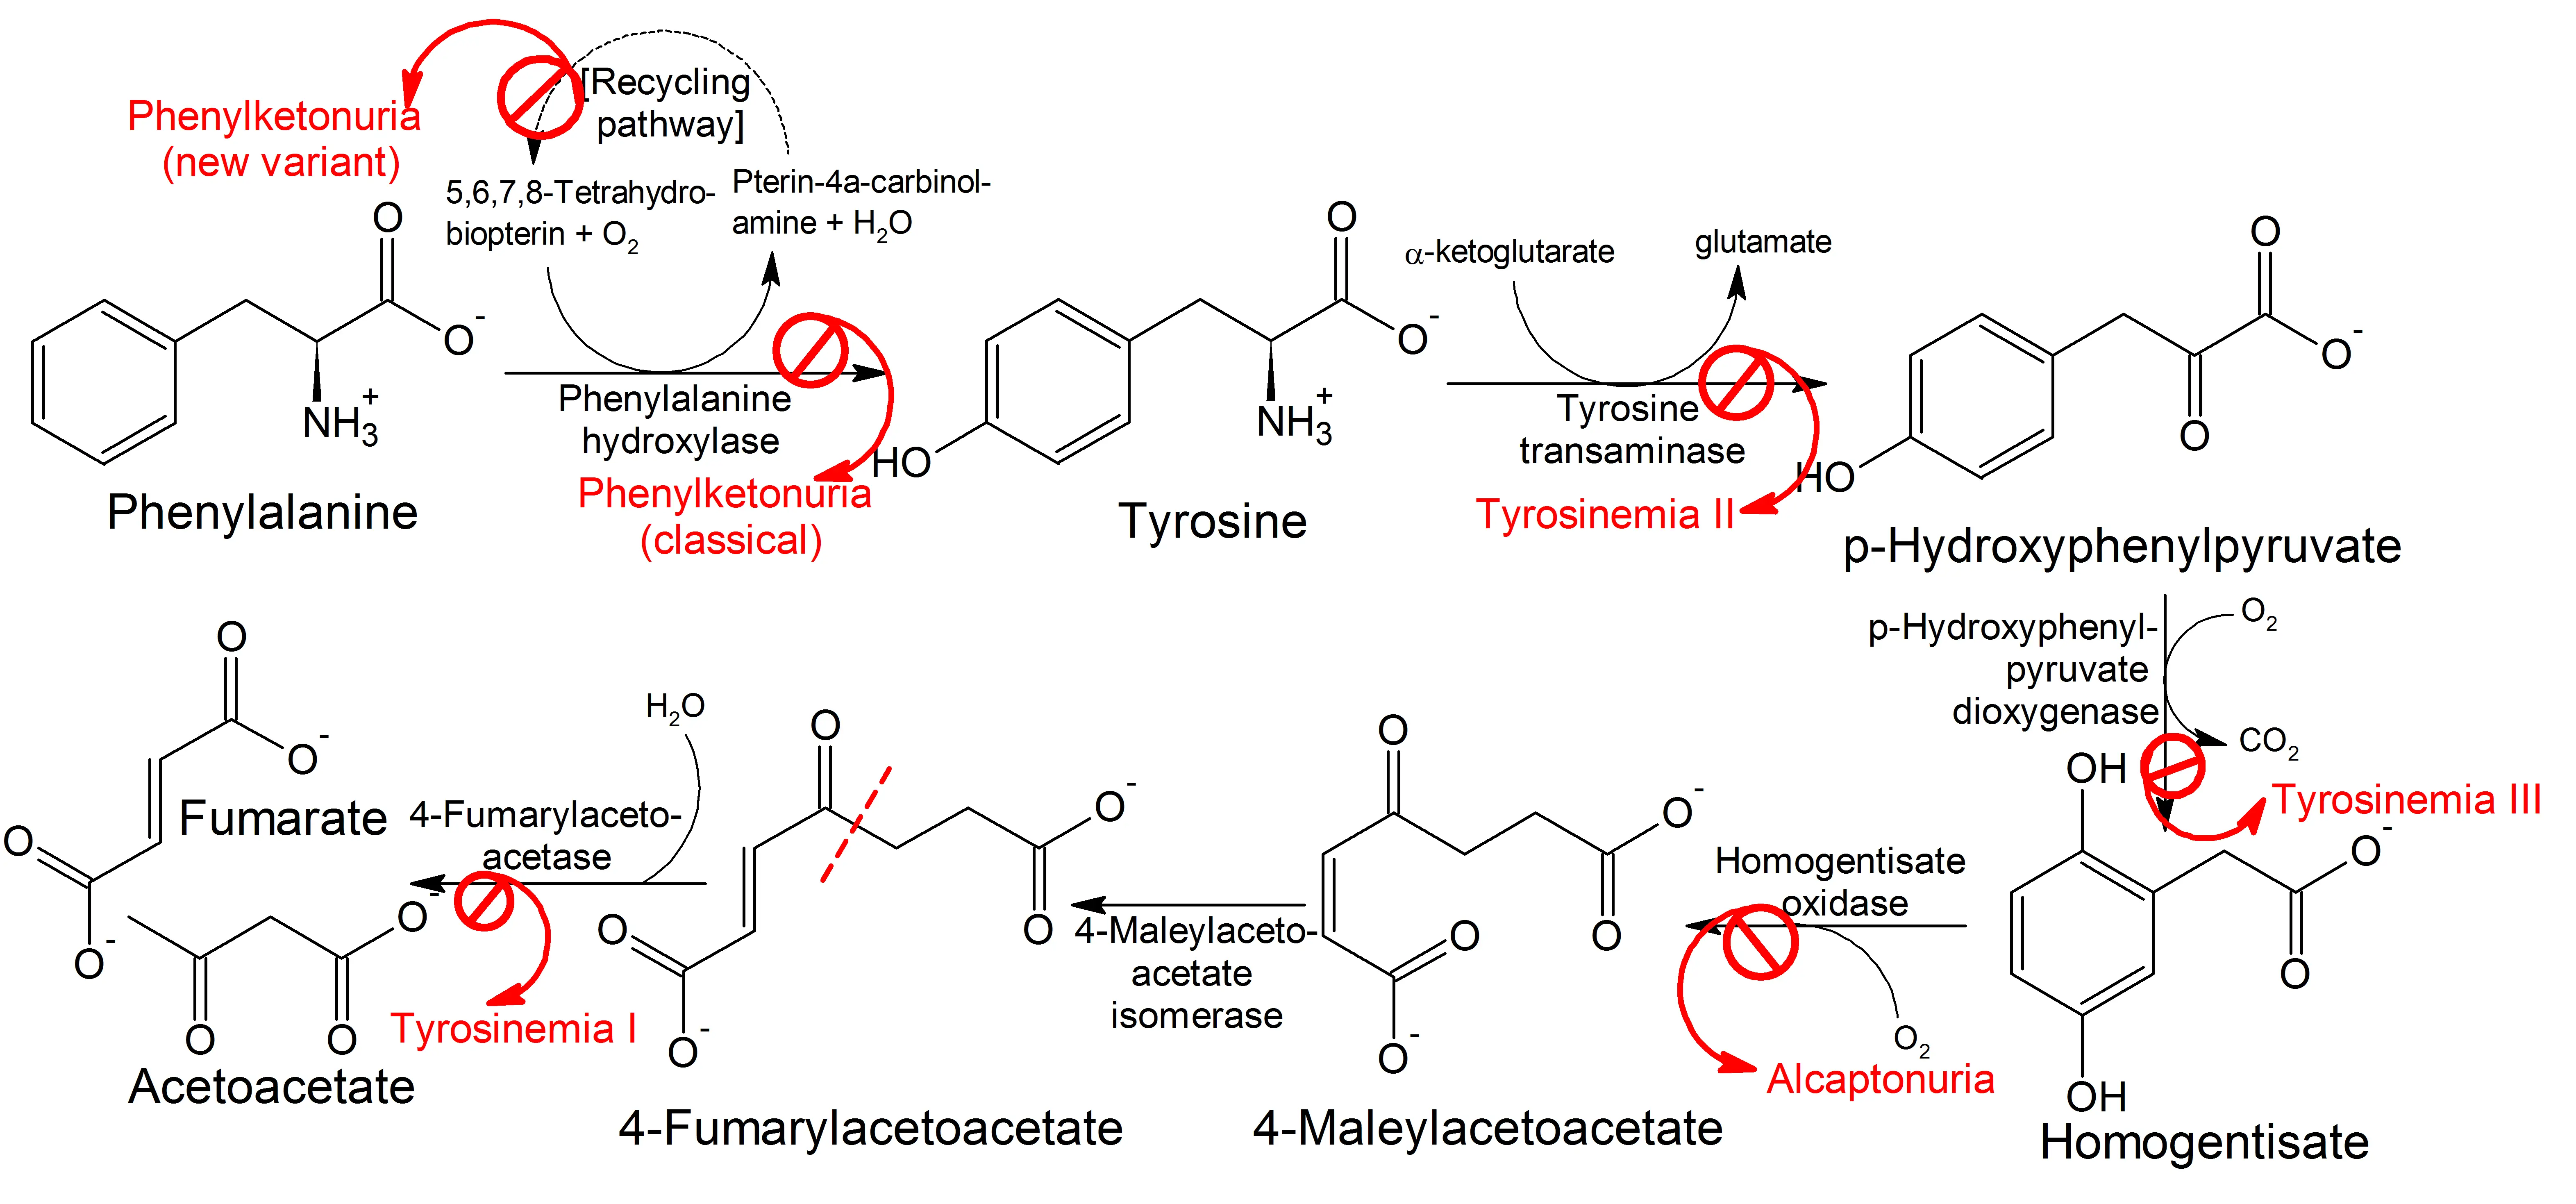
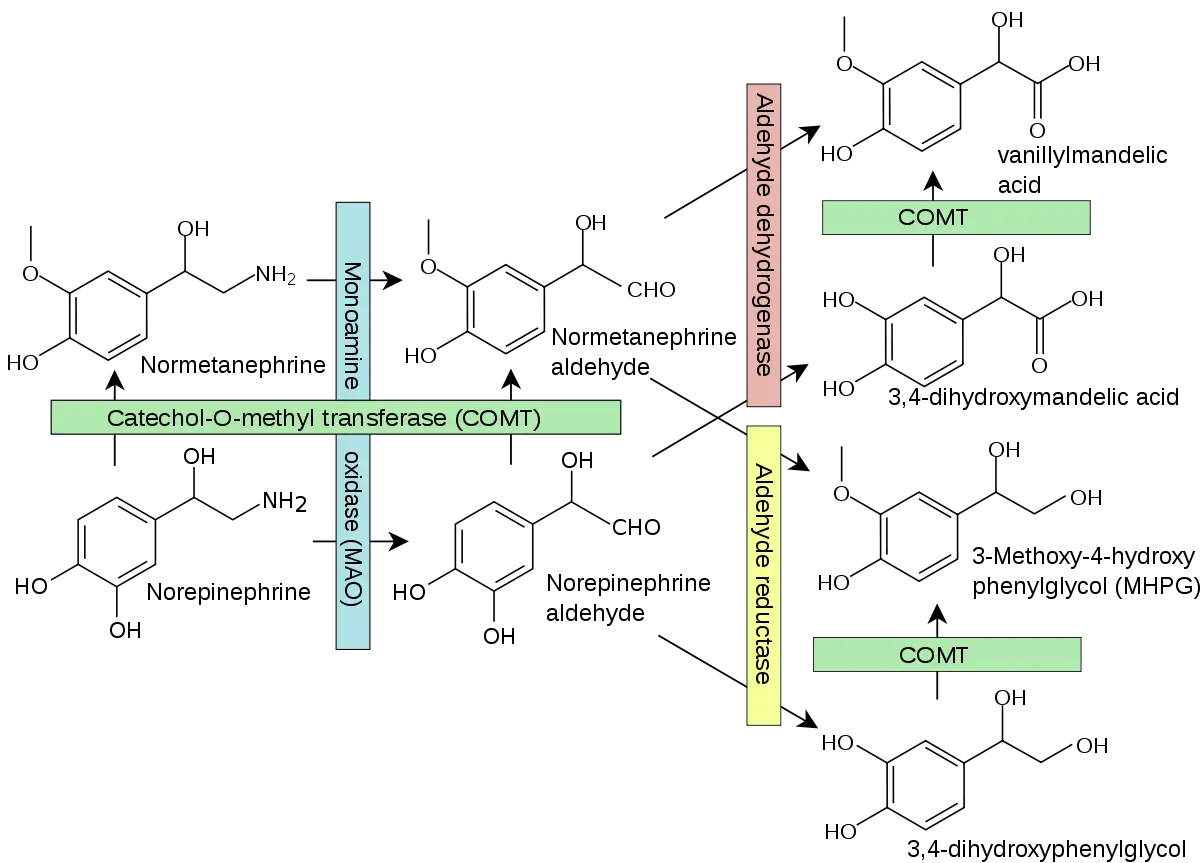
Phenylalanine and Tyrosine Metabolic Pathway -
Blood Test Icon -
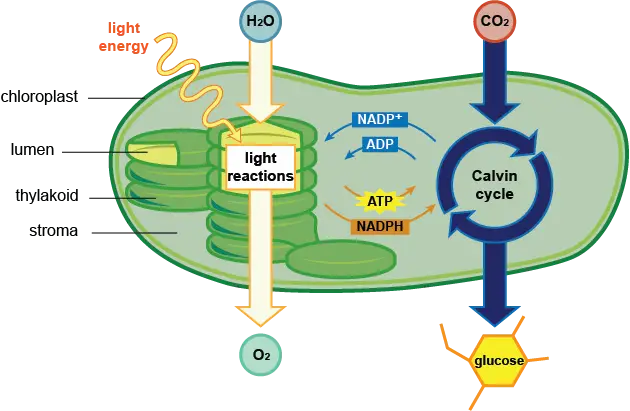
Educational Photosynthesis Diagram -
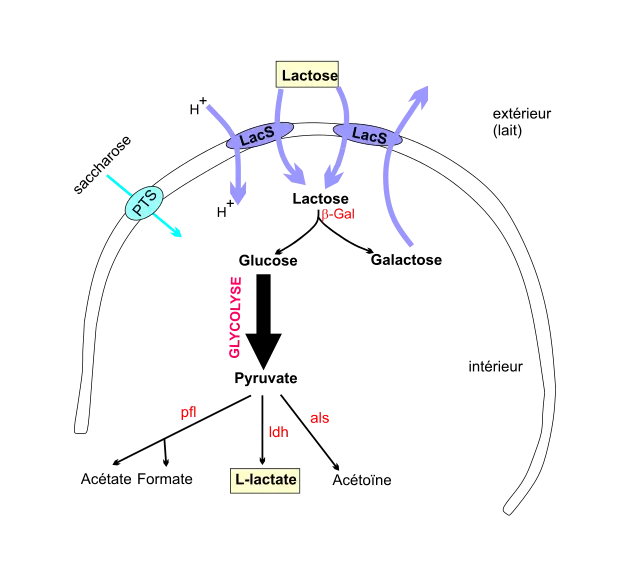
Lactose Metabolism Diagram -
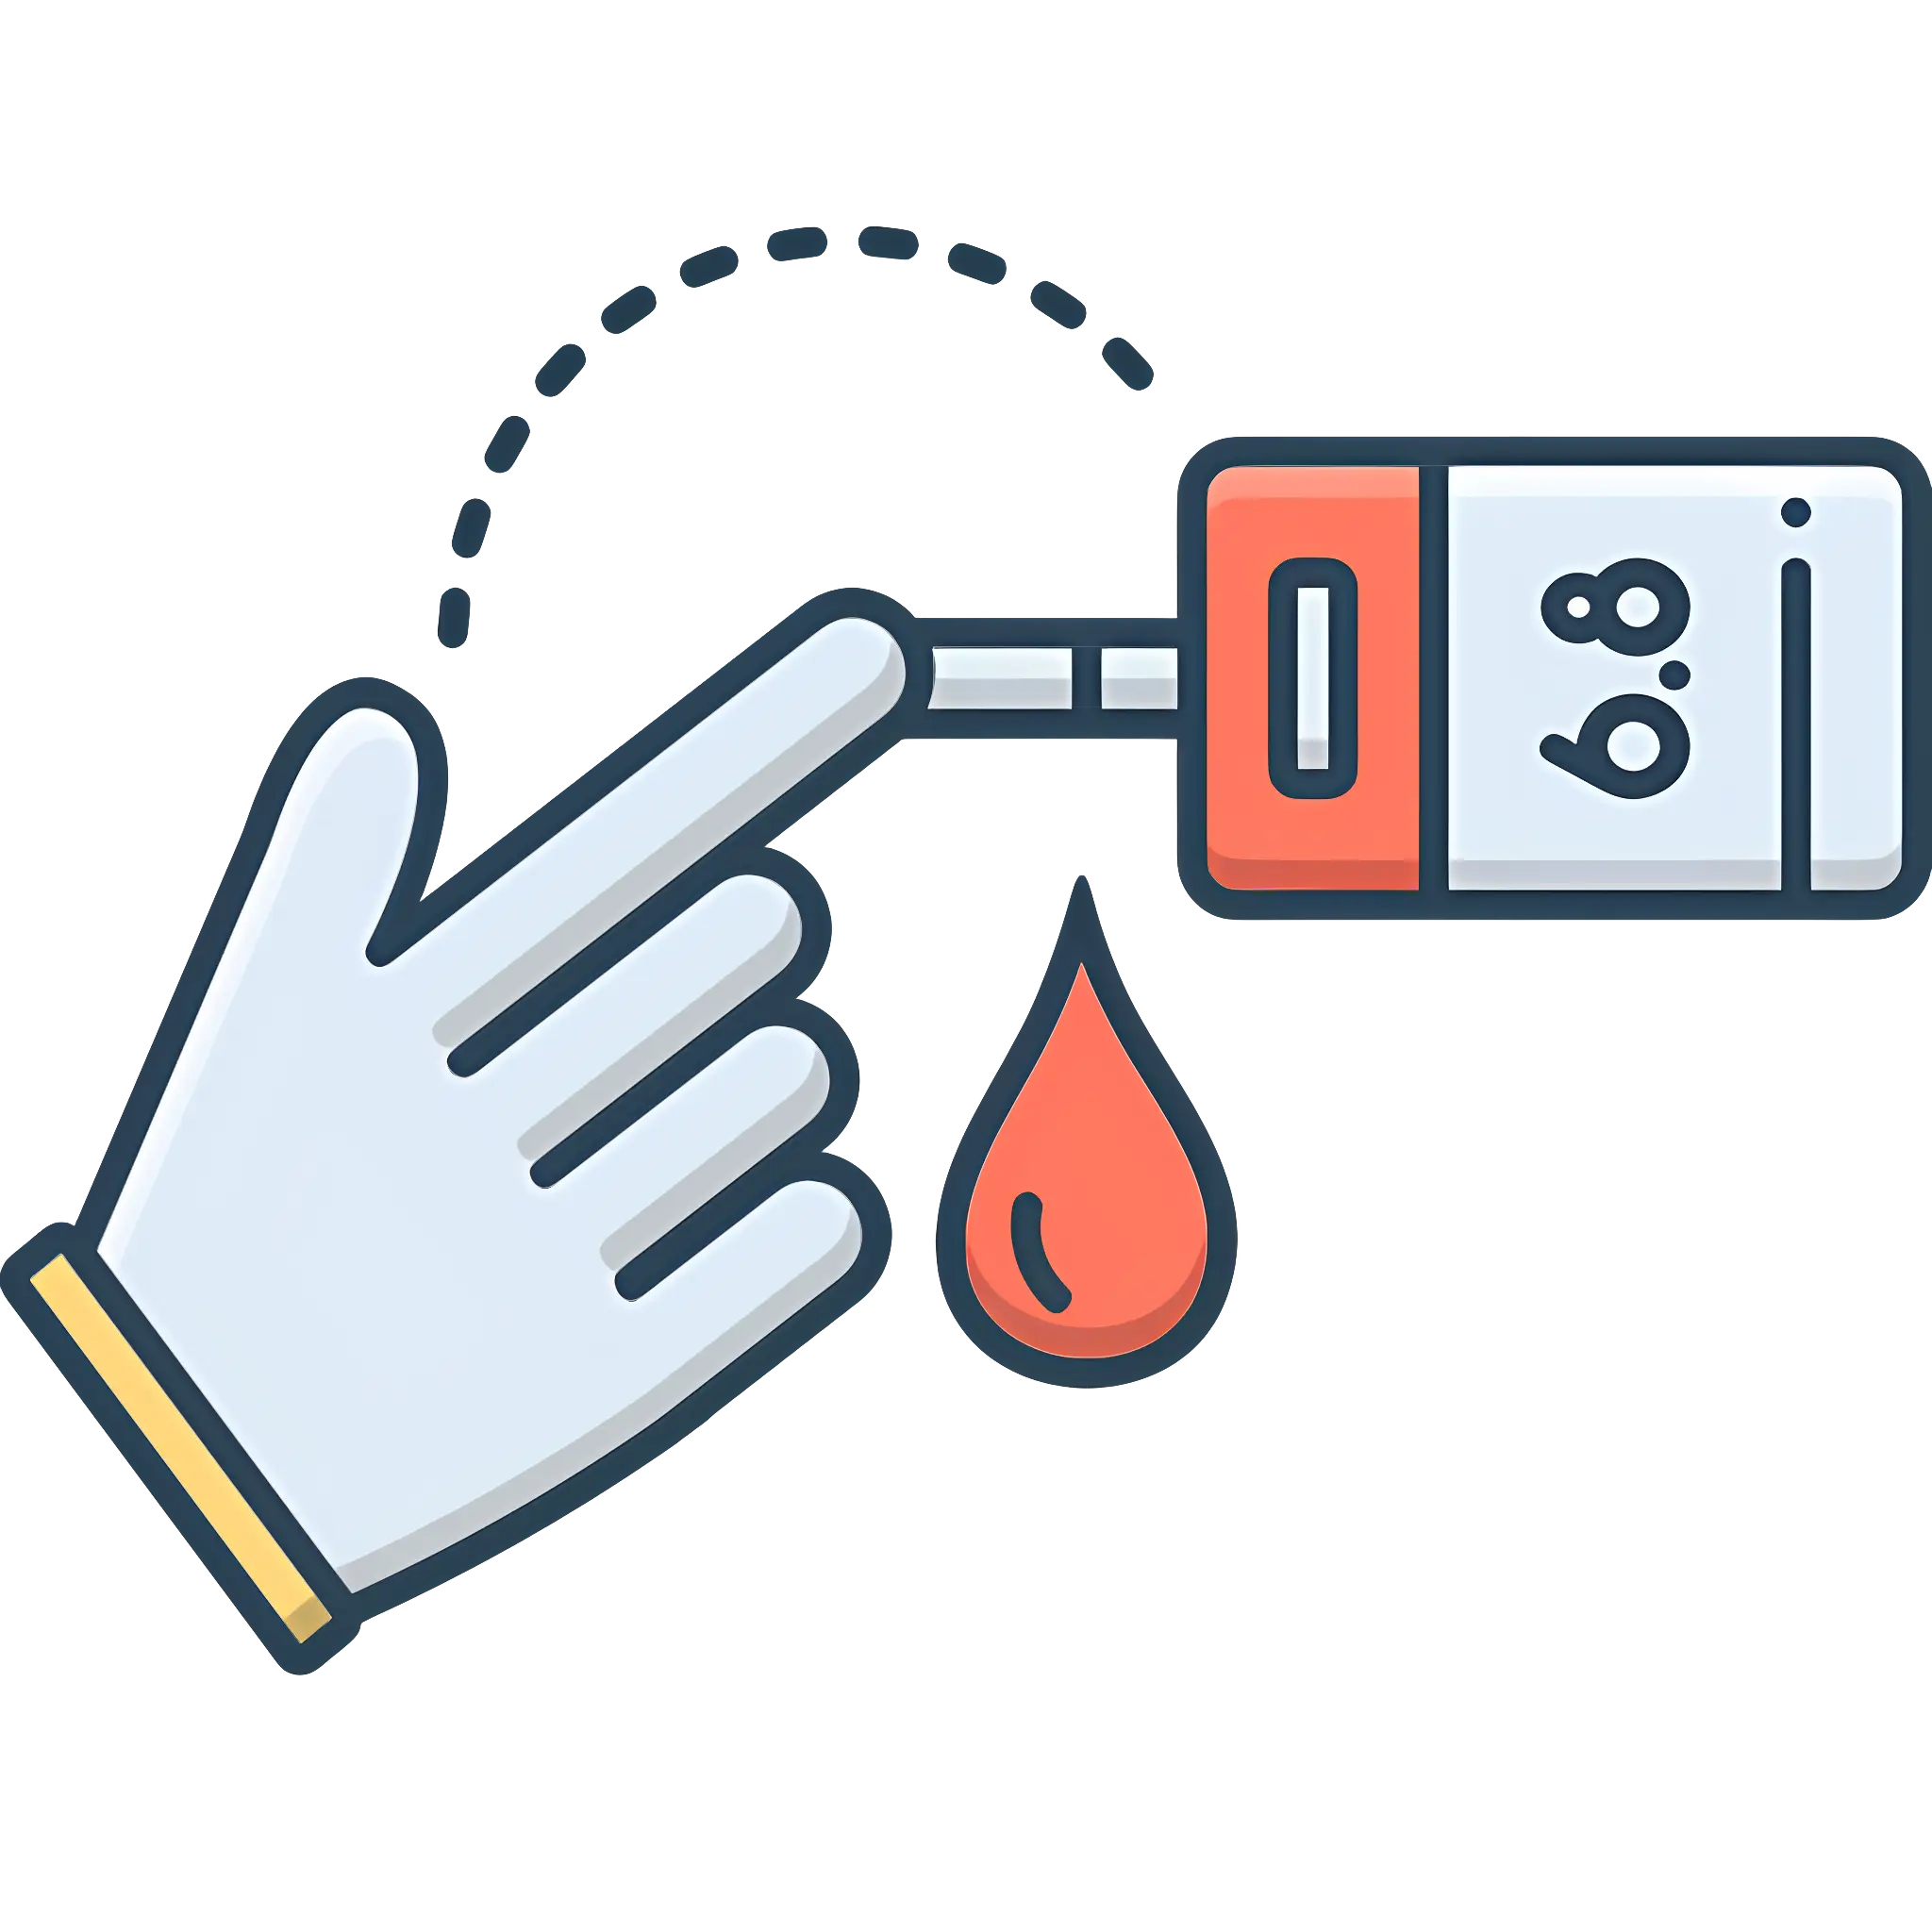
Blood Glucose Meter with Finger and Blood Drop -
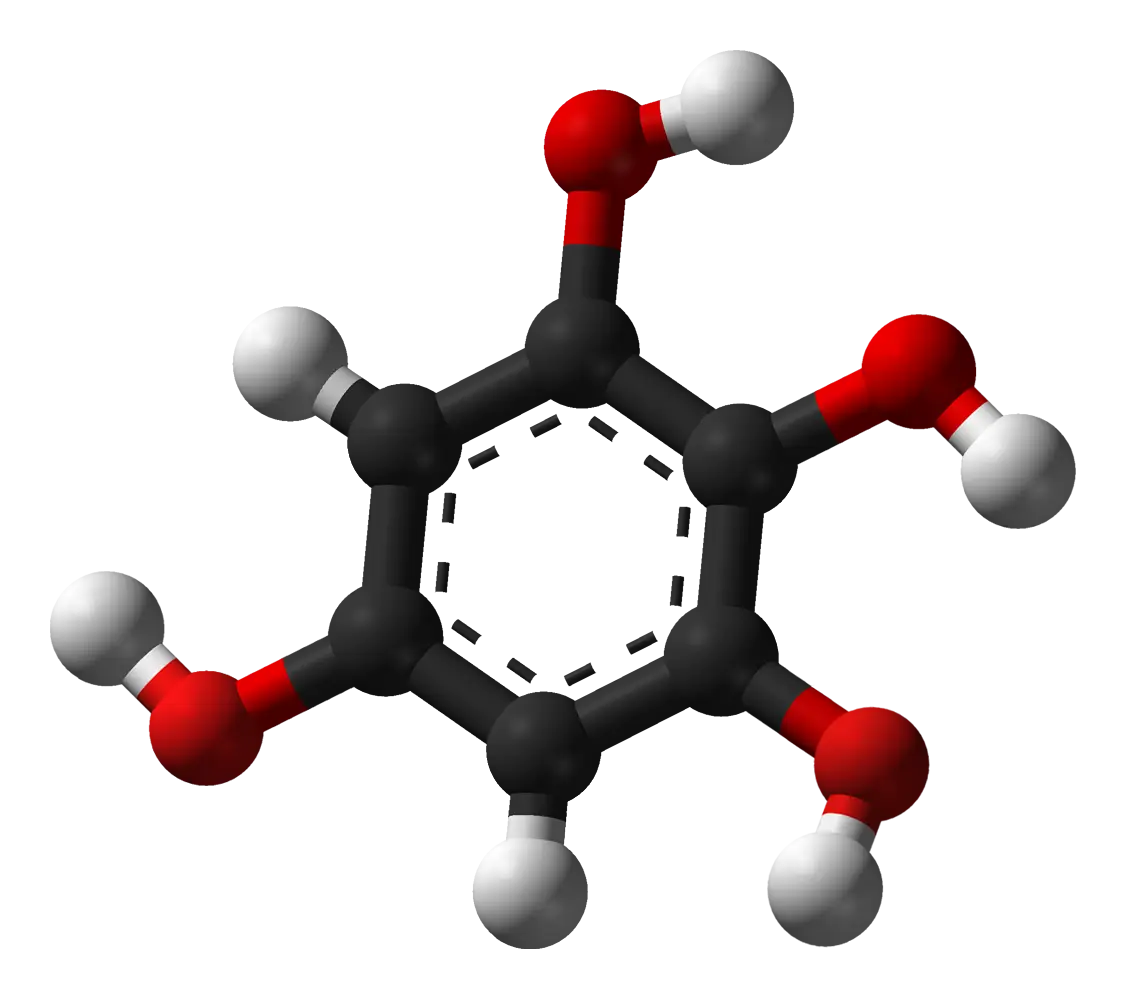
Molecule Structure Scientific Illustration -
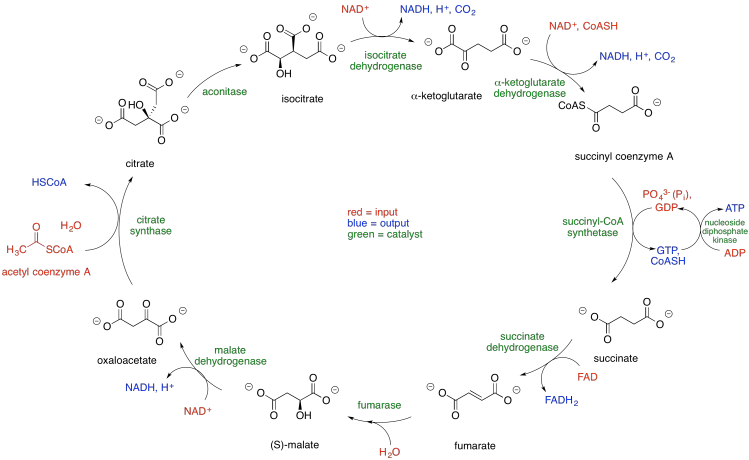
Krebs Cycle Diagram for Science Education -
Blood Glucose Meter with Finger Prick -
Chemical Structure Diagram -
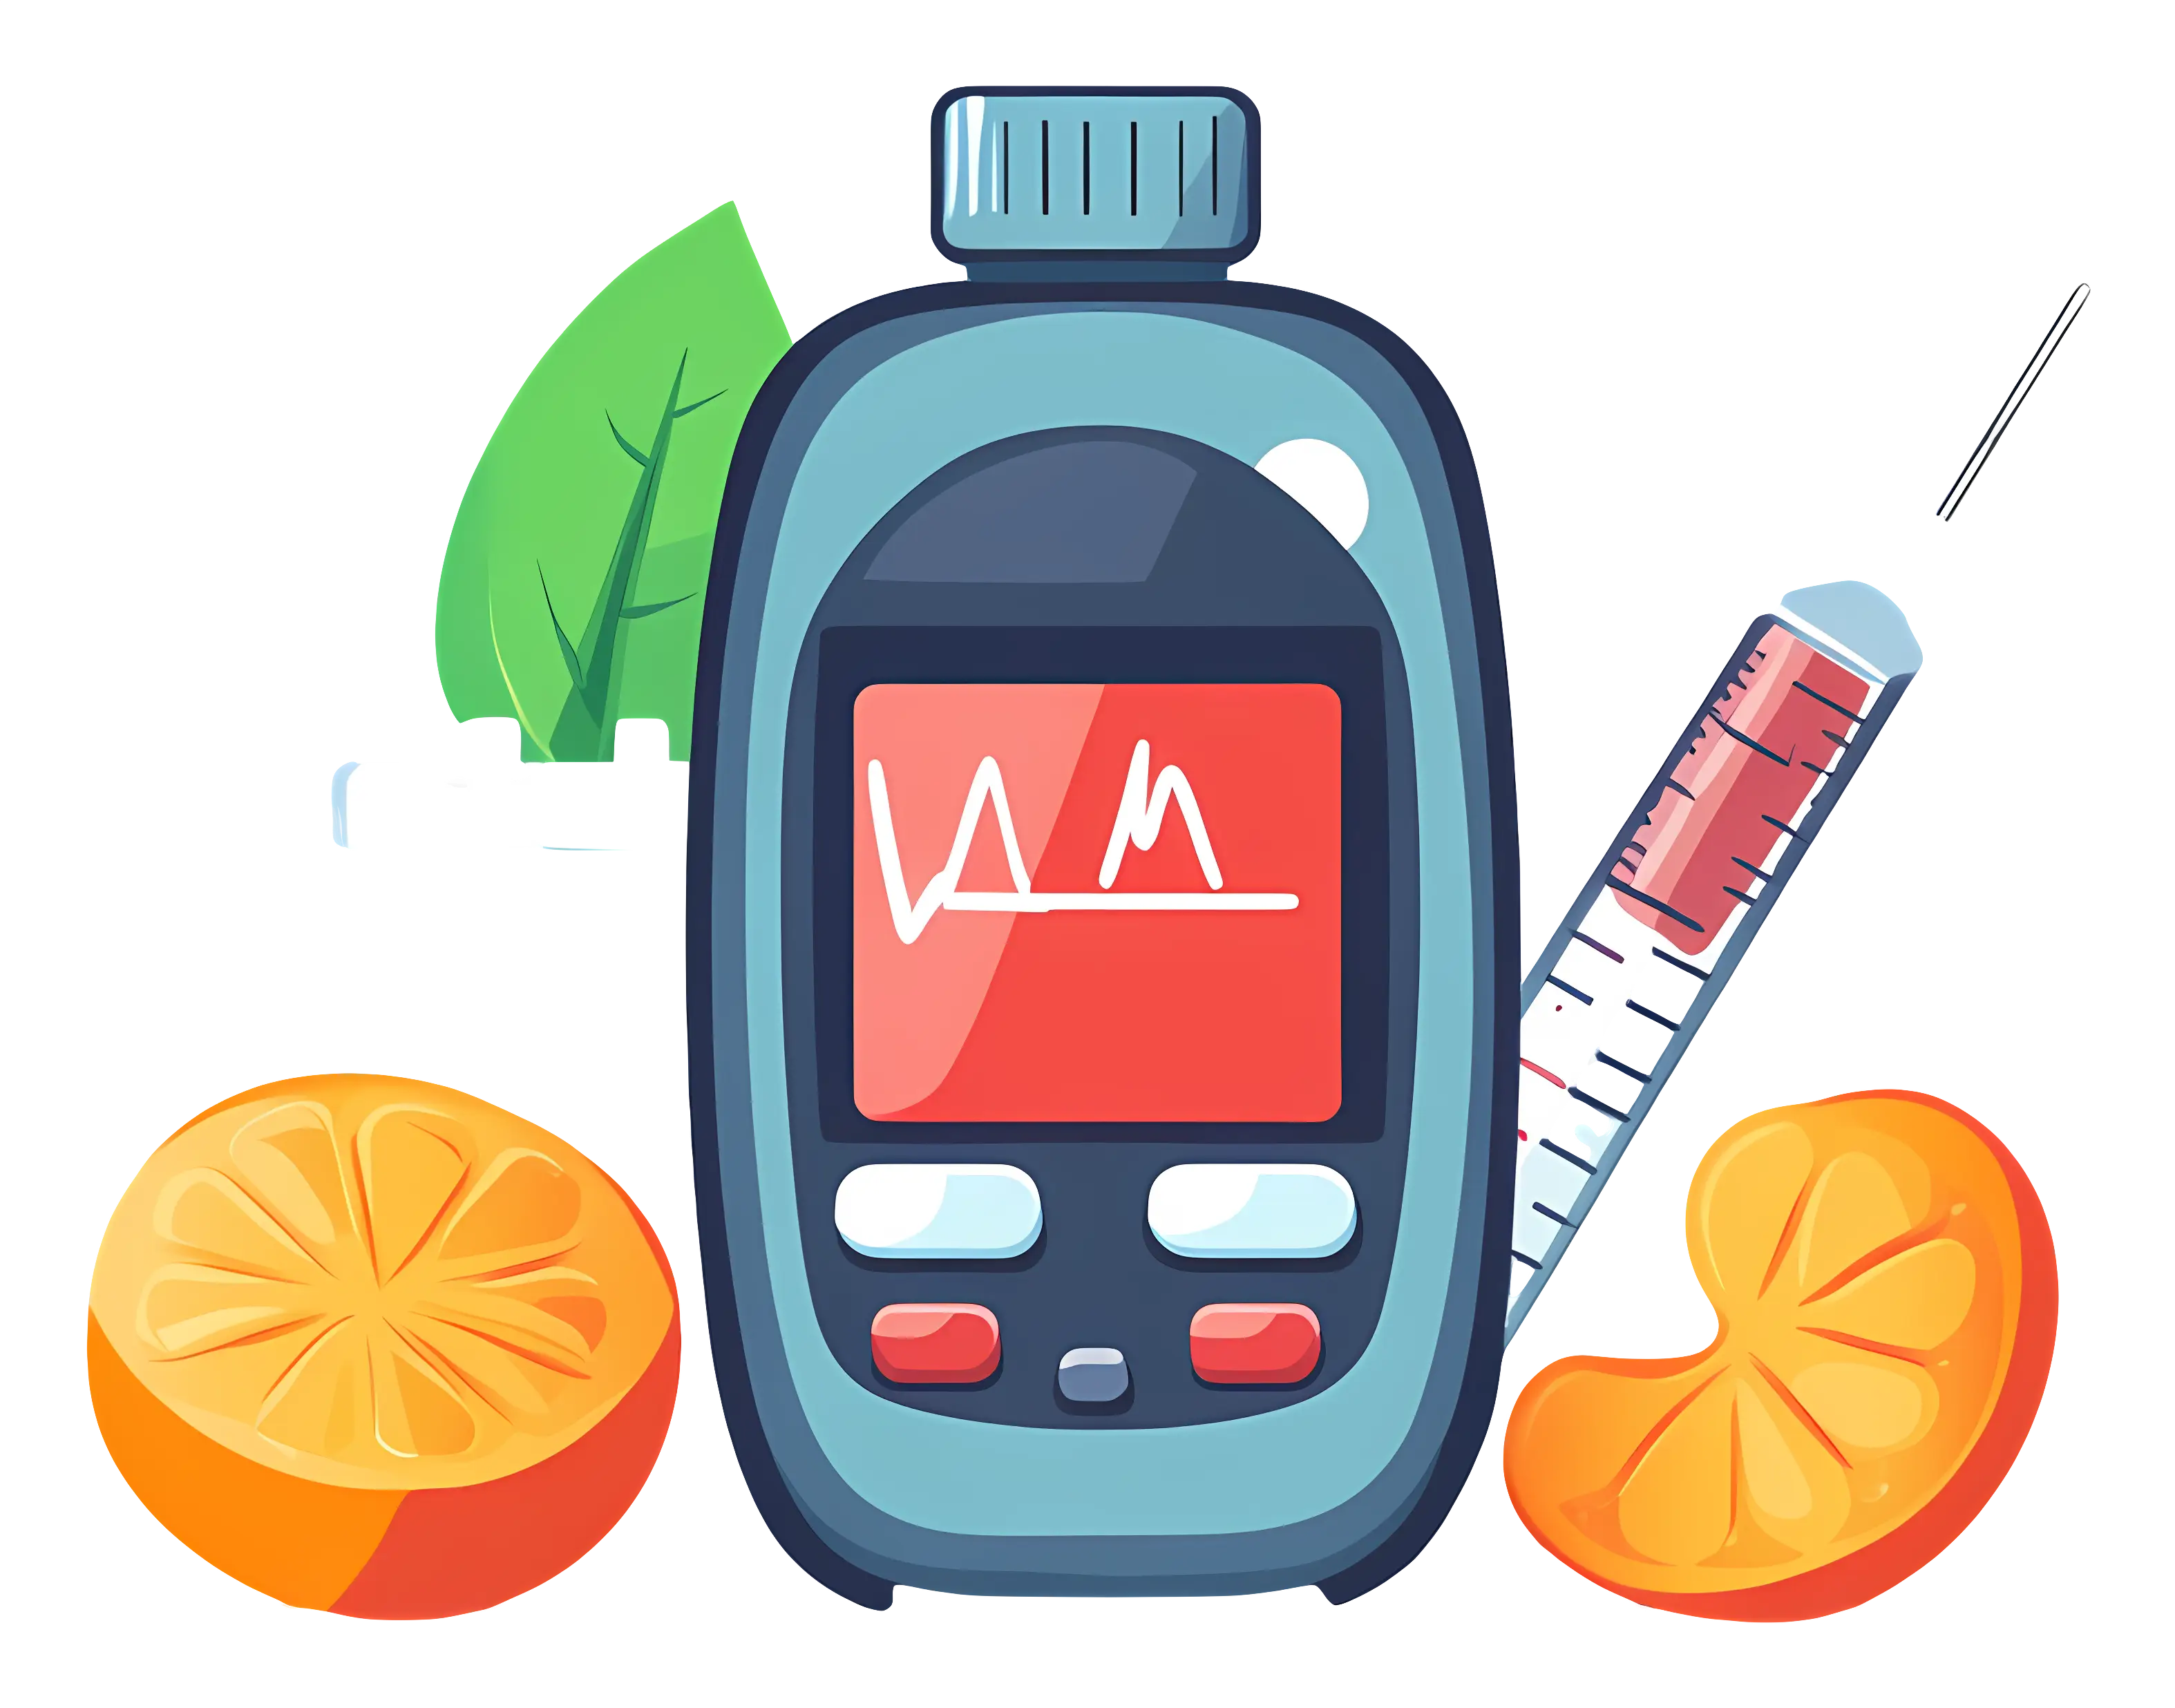
Glucose Meter with Syringe and Oranges -
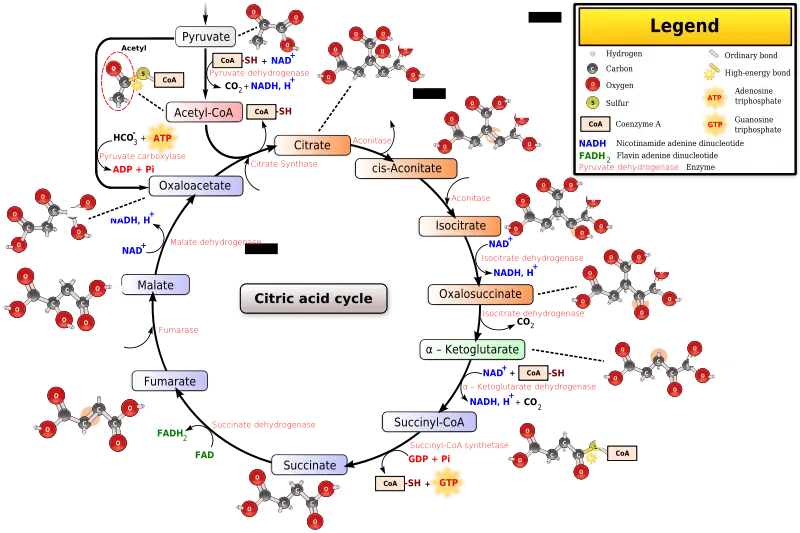
Detailed Citric Acid Cycle Educational Diagram