You Might Like
-

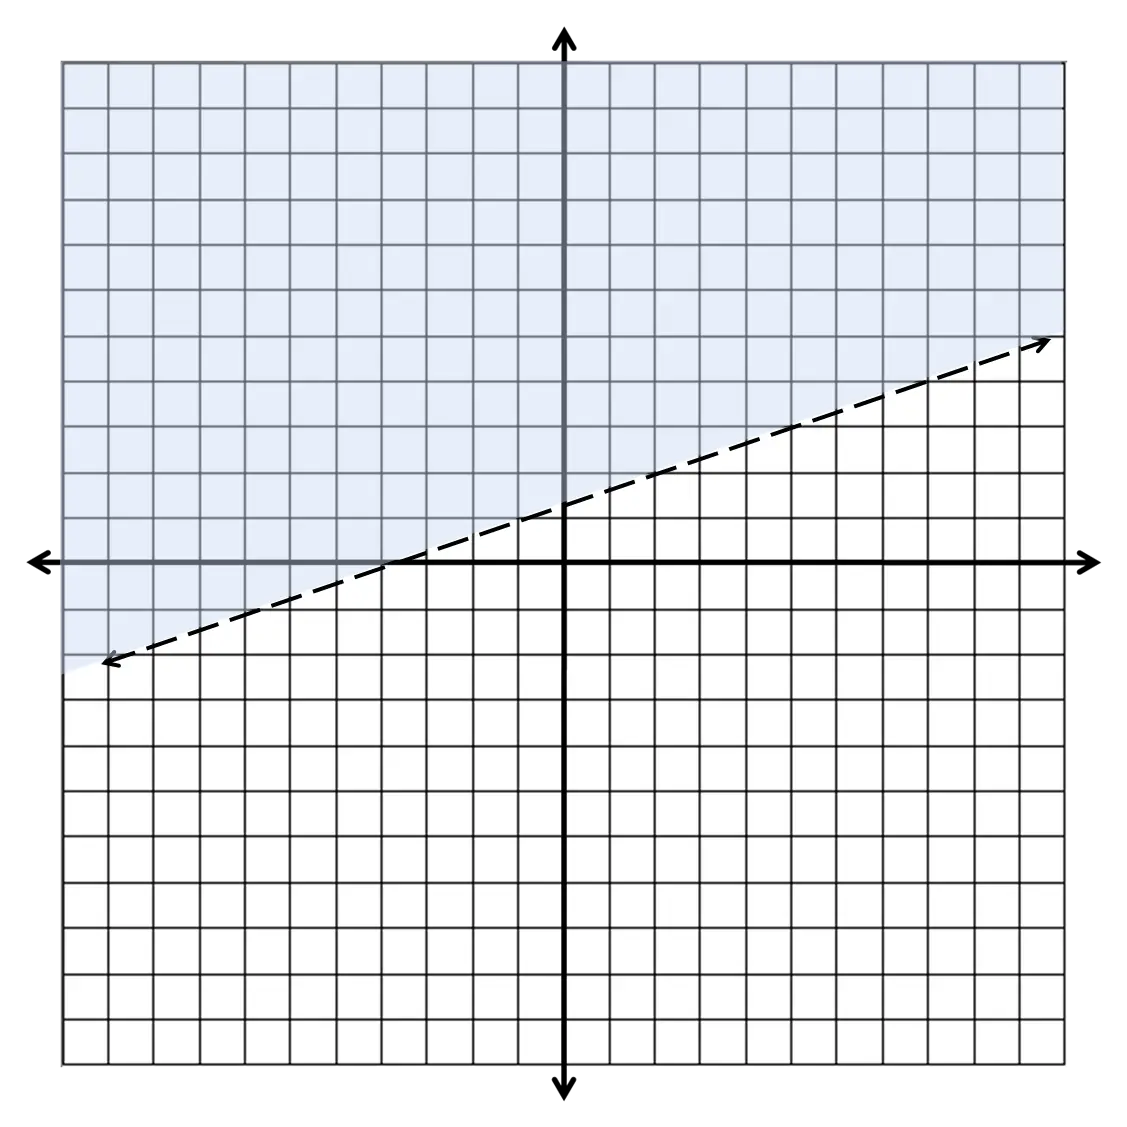
Mathematical Geometry and Graph Concepts -

Zigzag Down Arrow Icon for Decline Representation -

Graph Plot with Blue Curve Illustration -

Vertical Double-ended Arrow -

3D Coordinate System Illustration -

Blue Declining Bar Graph with Arrow -

Circle Pie Chart Icon -

Mathematical Formula Equation -

Traditional Abacus for Calculation and Learning -

Declining Chart Illustration -
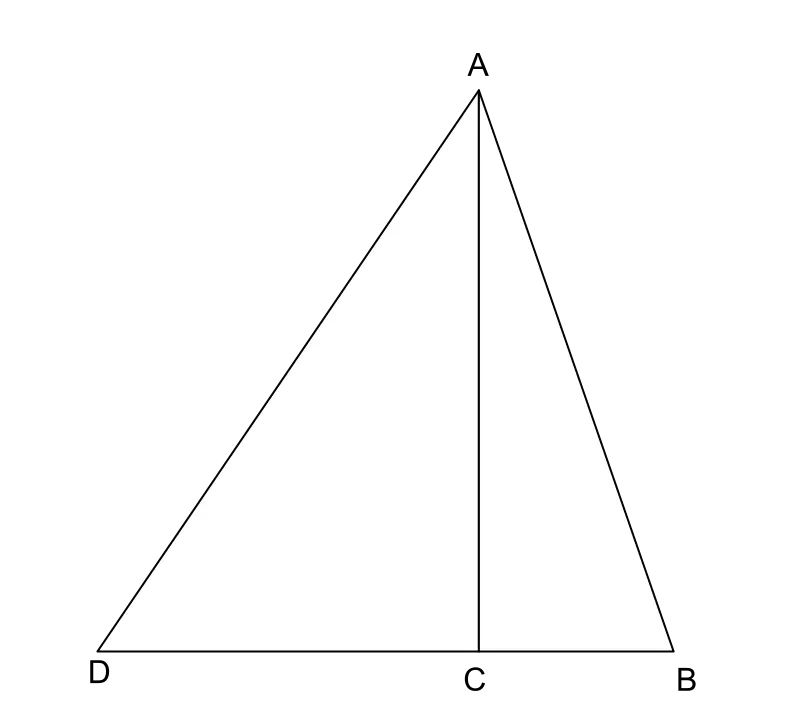
Triangle Diagram for Geometric Representation -

Magnifying Glass with Graph Illustration -
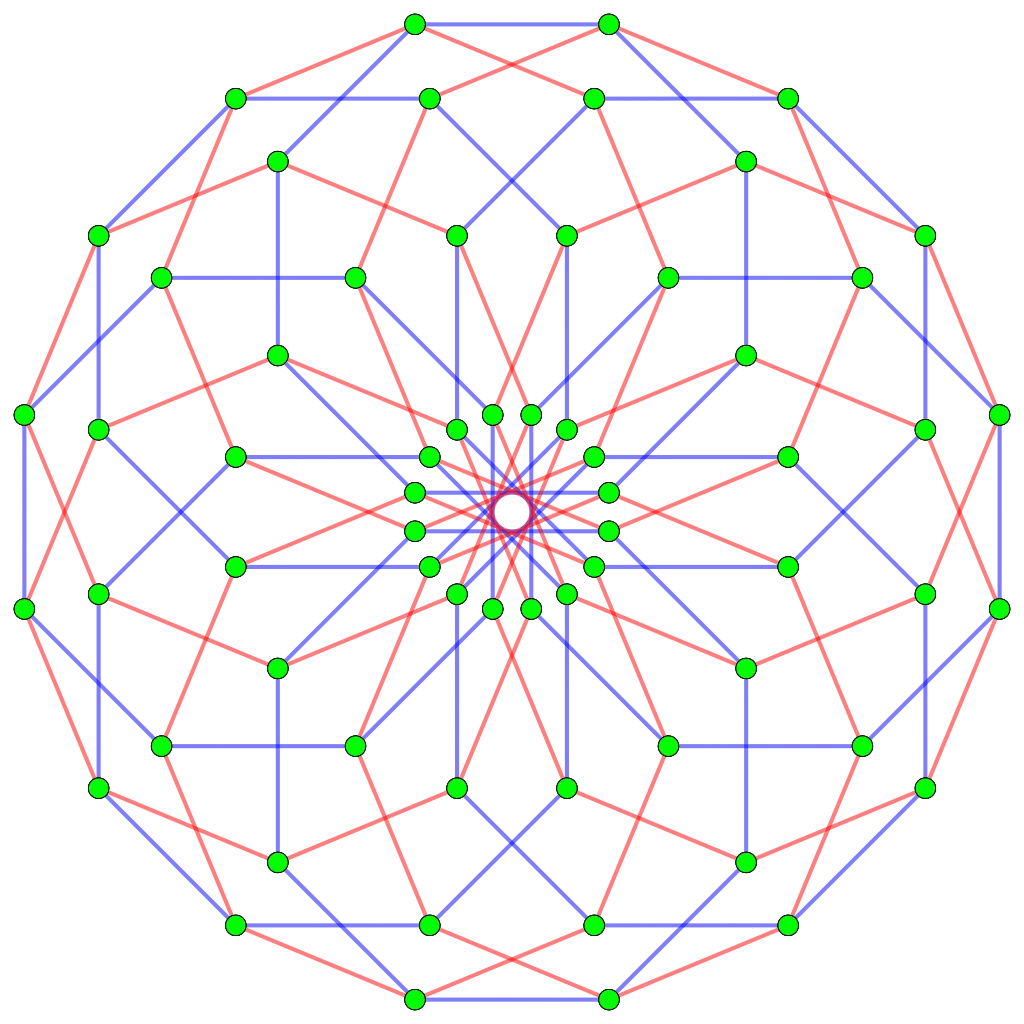
Mathematical Network Diagram with Nodes and Lines -
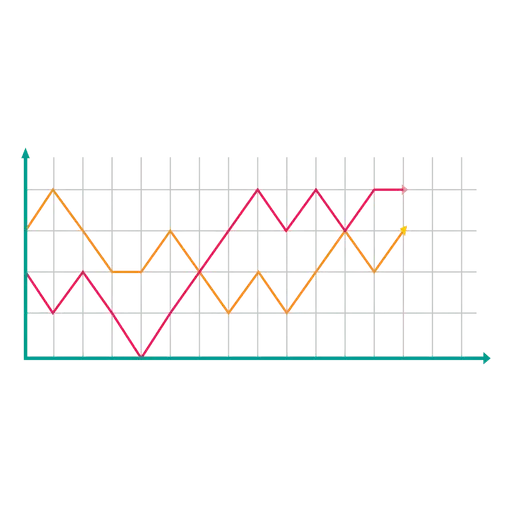
Line Graph for Data Visualization -

Abstract Yellow Streaks on Transparent Background -

Bar Chart Icon for Data Analysis -
Hexagon Shape -

Astronaut Doodle in Space-themed Outline -
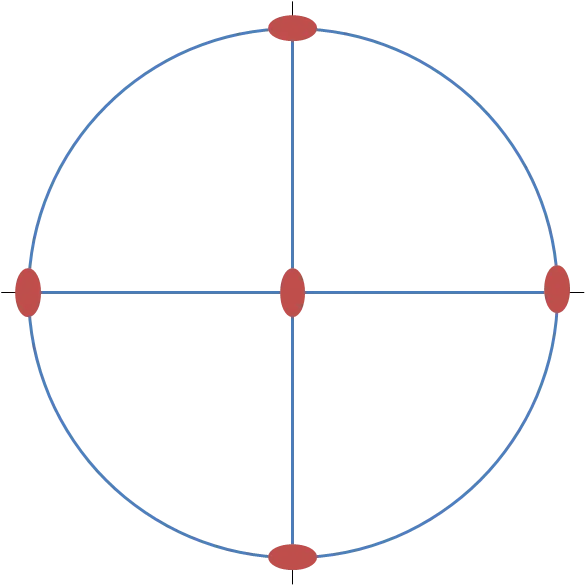
Geometric Circle with Points -

Stylized Grass Silhouette Artwork -

Red Downward Arrow Crashing -

Colorful Descending Bar Graph Illustration -
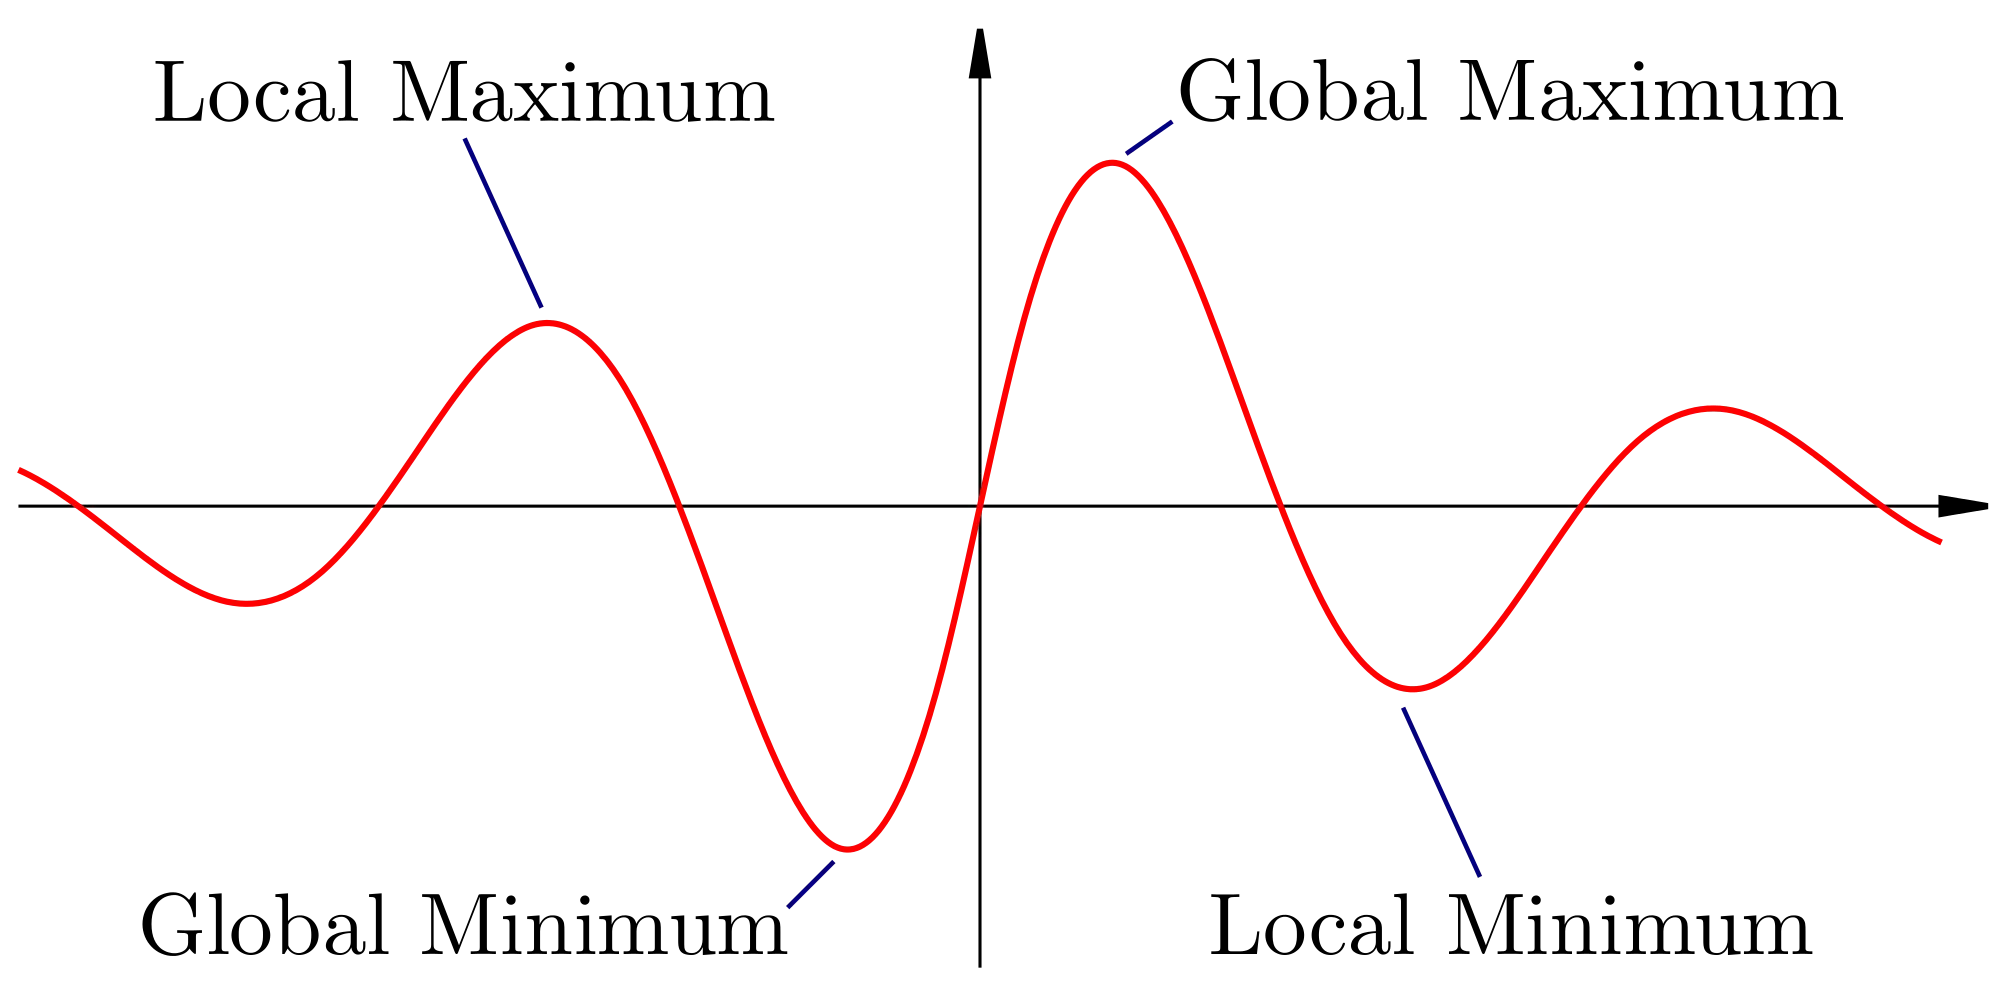
Graph with Local and Global Extrema -

Mathematical Symbol for Equations -

Complex Mathematical Equations -
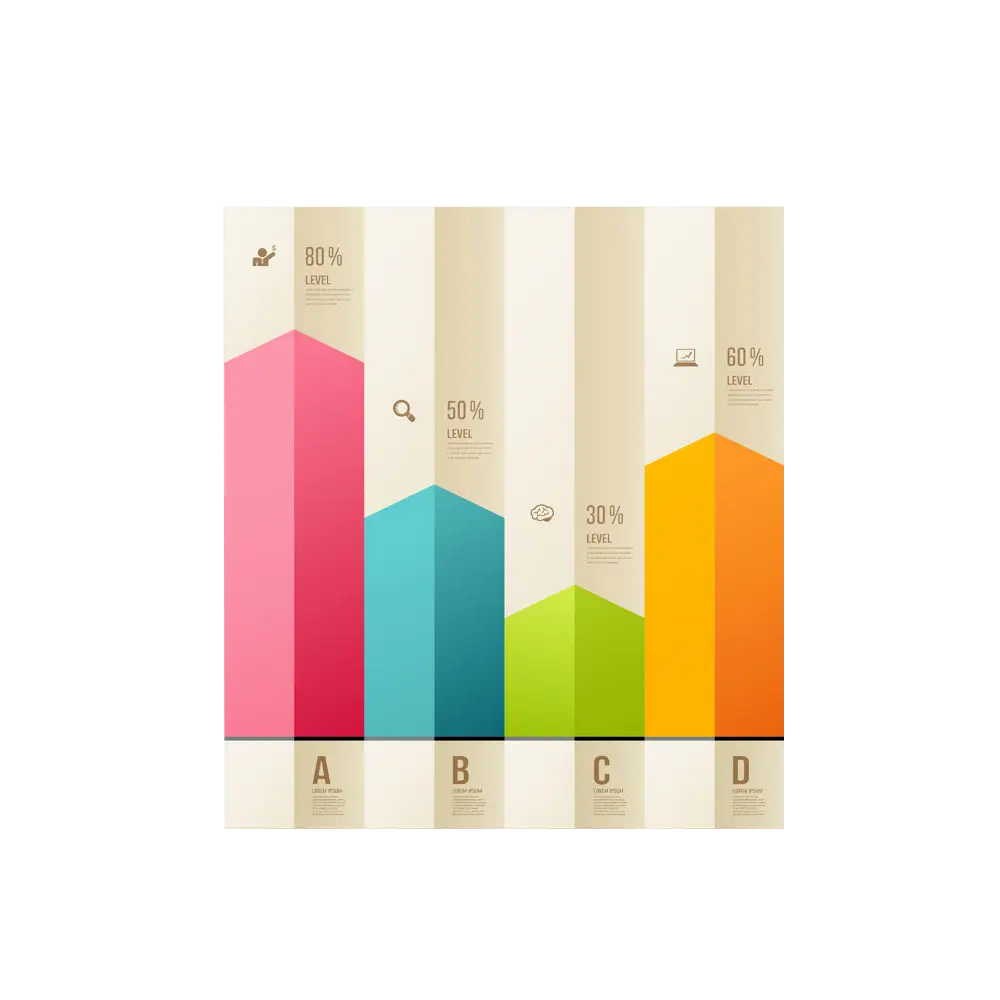
Colorful Bar Chart Infographic -
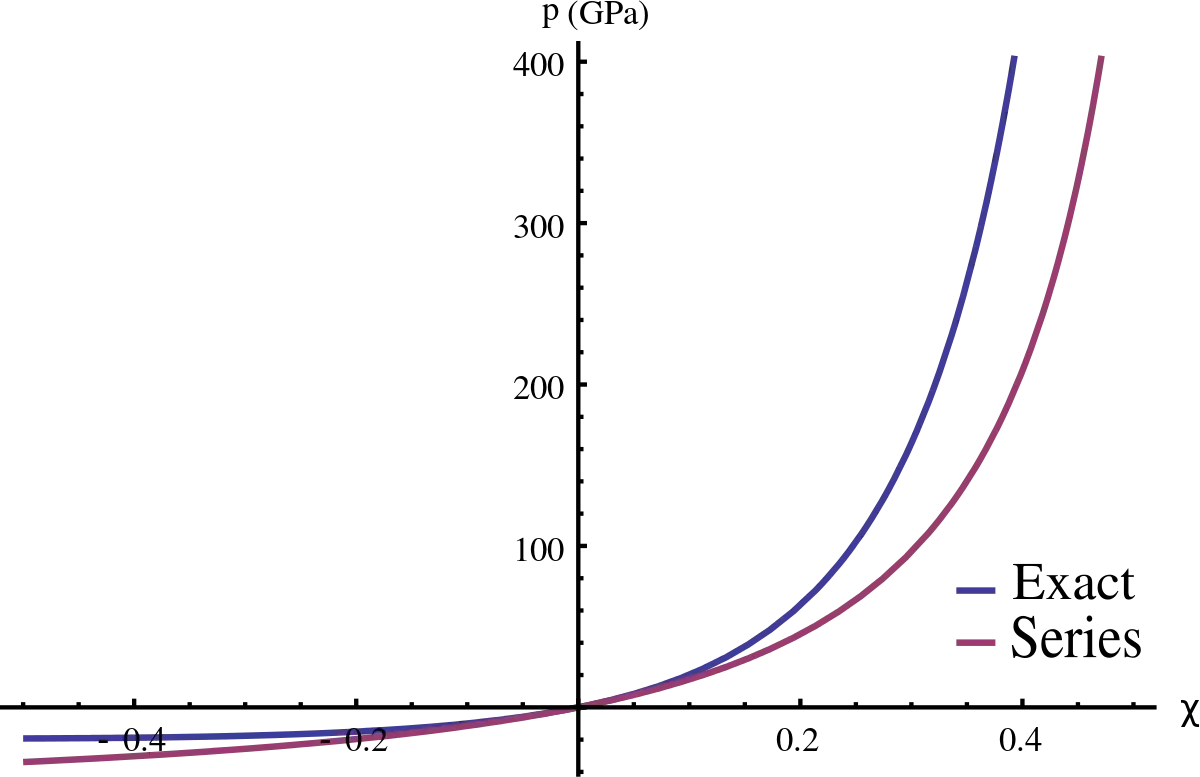
Exact vs Series Data Graph -

Network Structure Diagram Connecting Nodes -
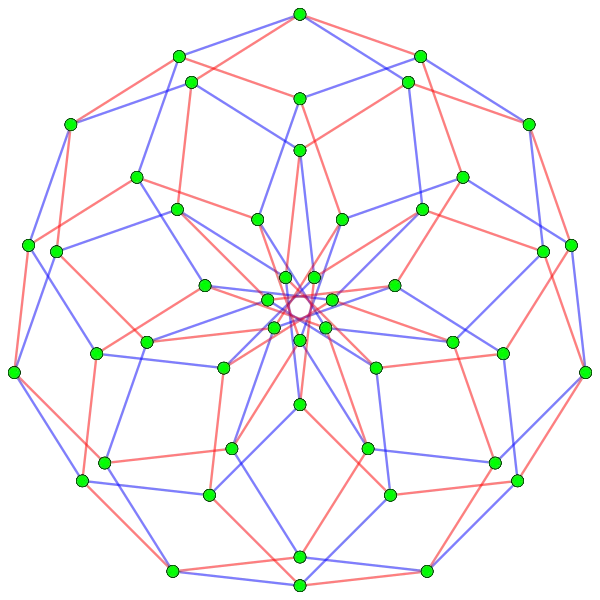
Geometric Node and Edge Structure Illustration -

Simple Blue Bar Graph Chart Illustration