
You Might Like
-

Checkmark Symbol Inside a Circle -

Hand Holding Plant with Energy Symbol -

Colorful Stack of Books with Decorative Leaves -

Man Holding Completed Checklist Illustration -

Team with Growth Graph Illustration -

Businessmen Climbing Stairs -

Organizational Structure Chart -
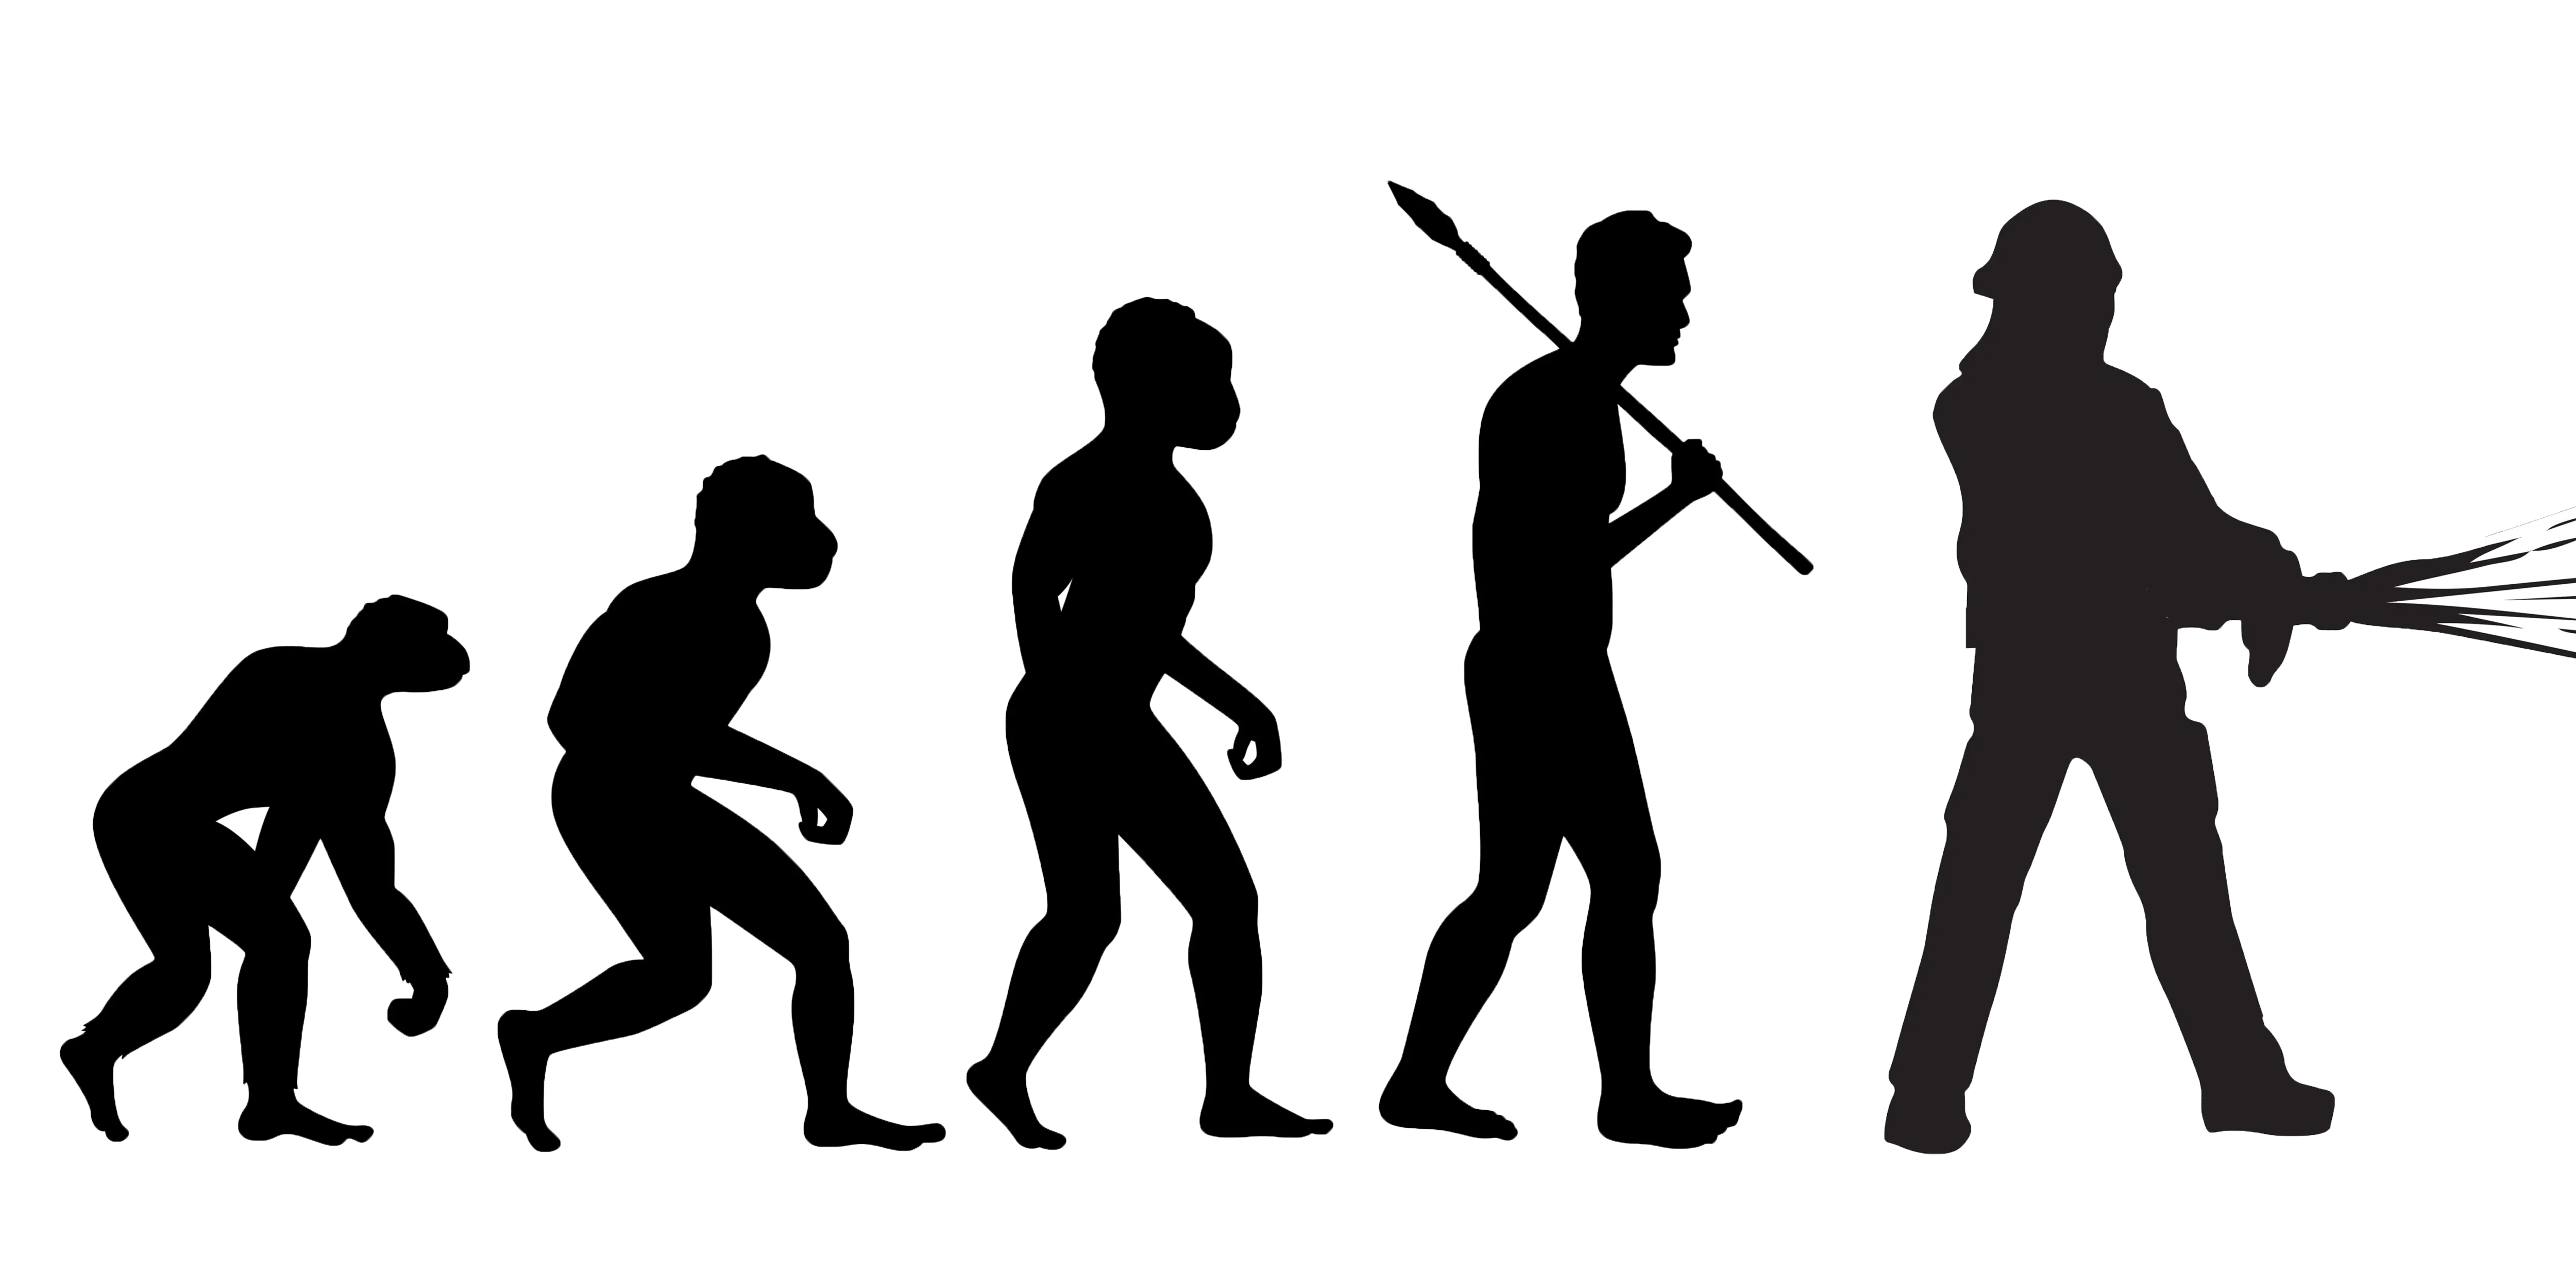
Evolution of Humanity Illustration -

Sun and Hands Symbol -

Simple Checklist Icon -

Magnifying Glass with Blue Lens -

Presentation Board with Graph for Business Concepts -
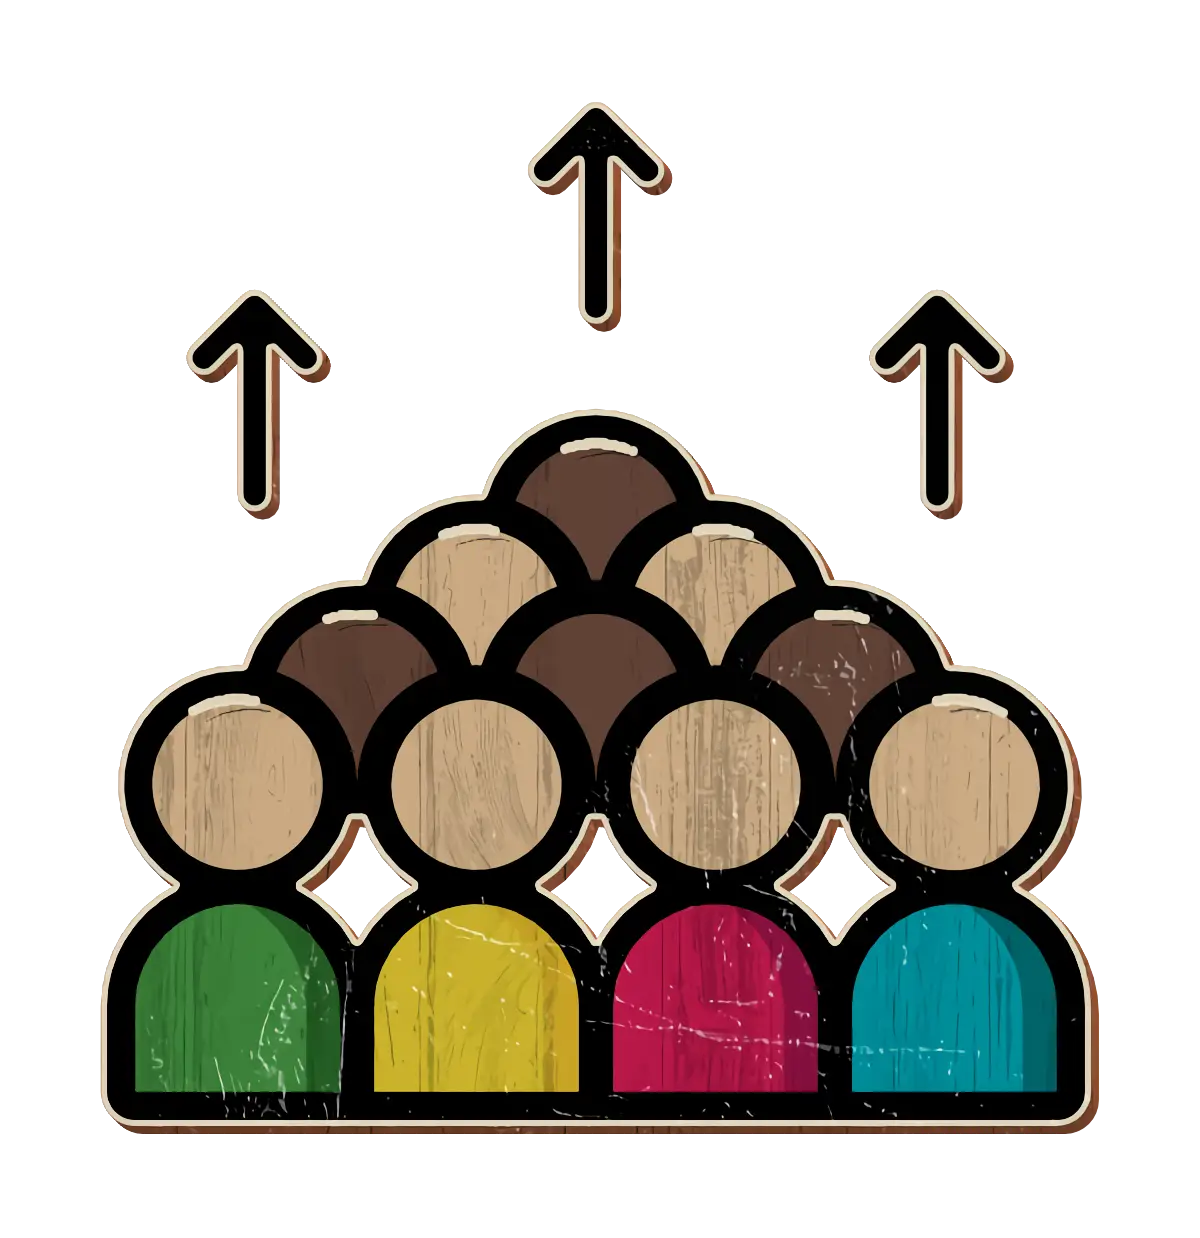
Group of People with Upward Arrows -

Bar Chart with Upward Arrow -

Infographic Pencil with Data Elements -

Graph Plot with Blue Curve Illustration -

Search Growth Icon -

Illustration of Growth Chart with Upward Arrow -

Business People with Circular Chart -

Old Tree with Branches and Leaves -

Curved Black Upward Arrow -
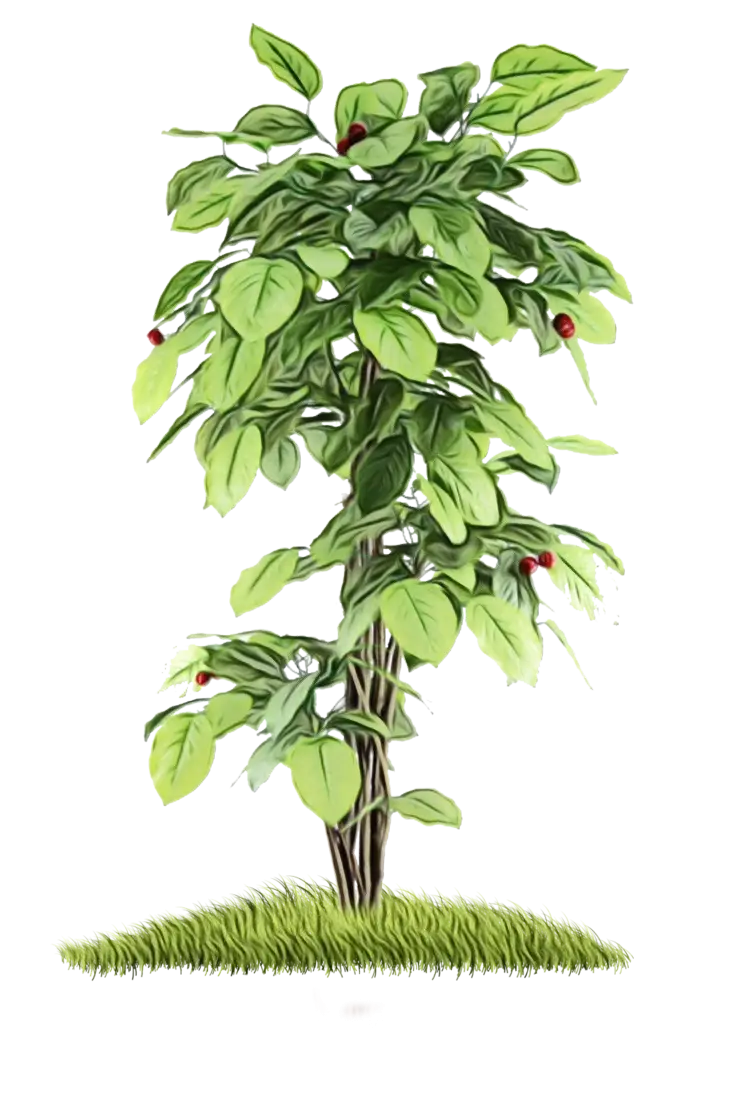
Green Tree with Red Fruits and Grass -

Pink Lotus Bud Flower -
Work in Progress Sign -
Green Vine Leaves -

Blue Declining Bar Graph with Arrow -
Tree with Handprints for Team Collaboration -

Circle Pie Chart Icon -

Bull Market Symbol -

Right Direction Arrow Symbol