You Might Like
-

Colored Regional Map of Africa -

Colorful Unicorn in Fantasy Style -

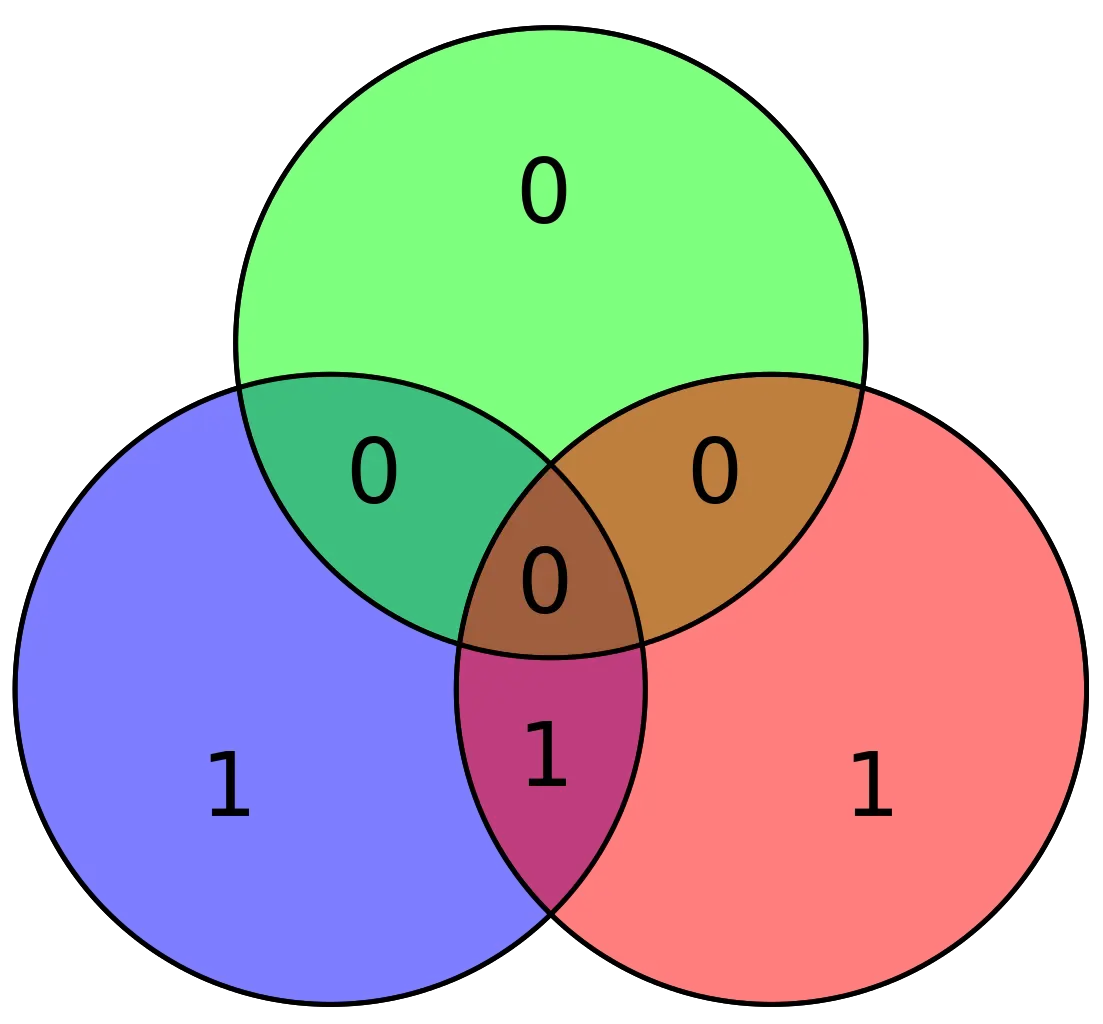
Mathematical Geometry and Graph Concepts -

Various Devices Displaying Software -

Complete Blue World Map -

Icon of KPI Dashboard with Graph and Person -

Bar Chart with Upward Arrow -
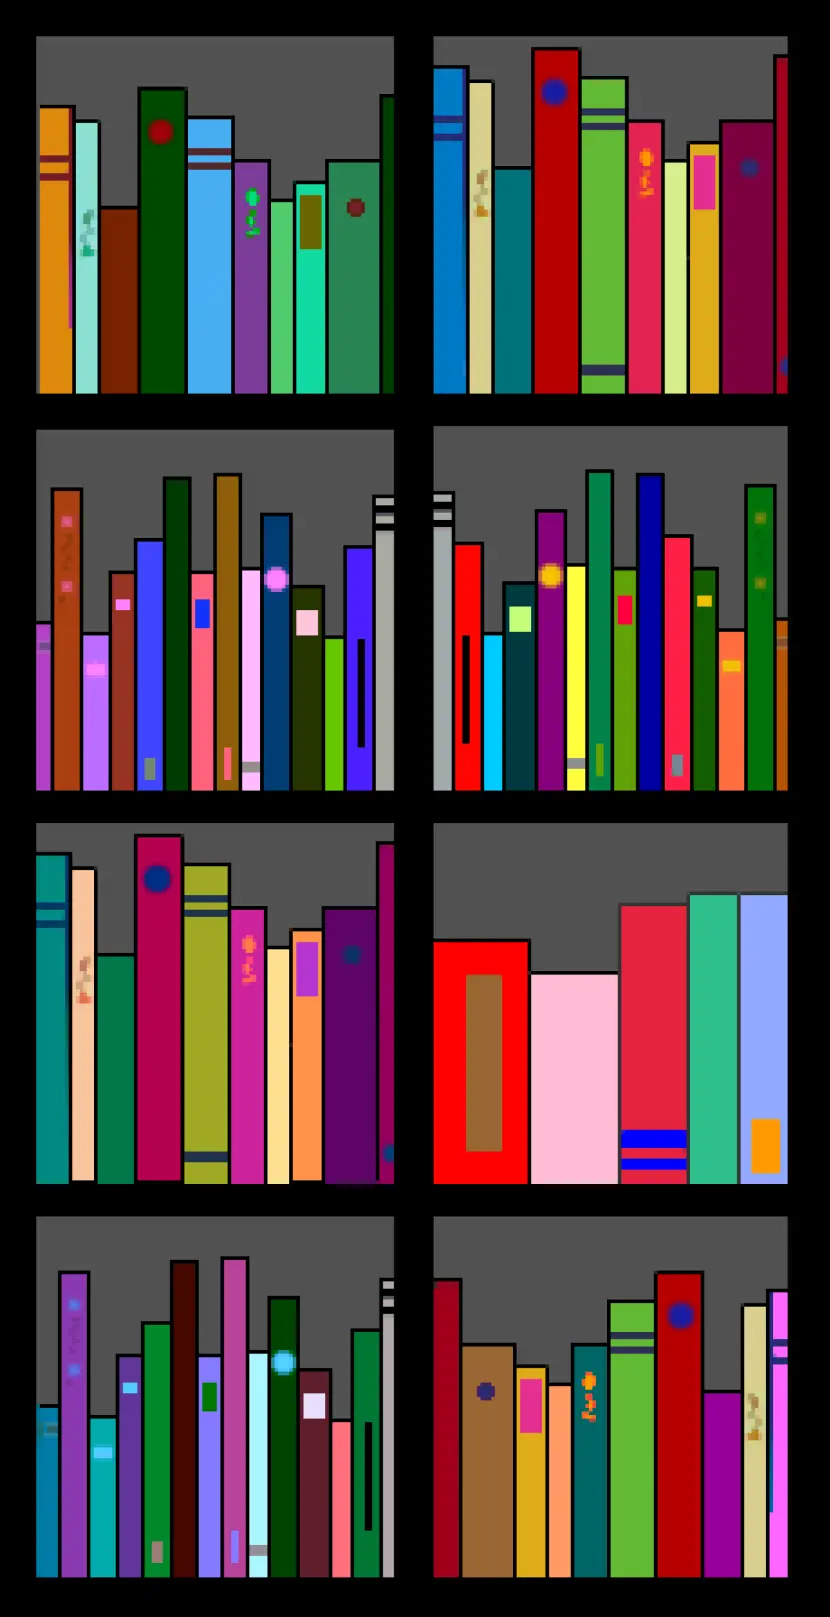
Colorful Bookshelf -
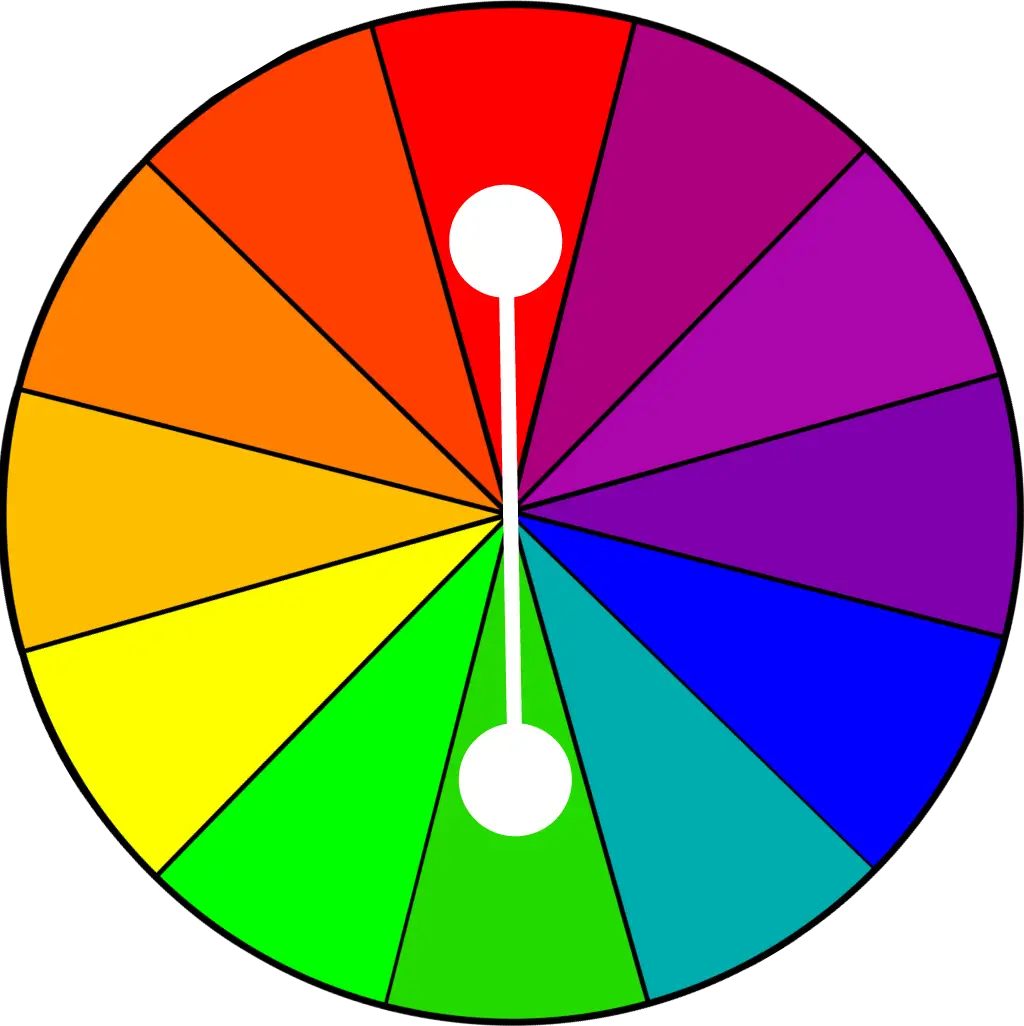
Color Wheel for Artistic Inspiration -

Search Growth Icon -

Illustration of Growth Chart with Upward Arrow -

Black and Teal Circles Minimalistic Pattern -

Digestive System Diagram -
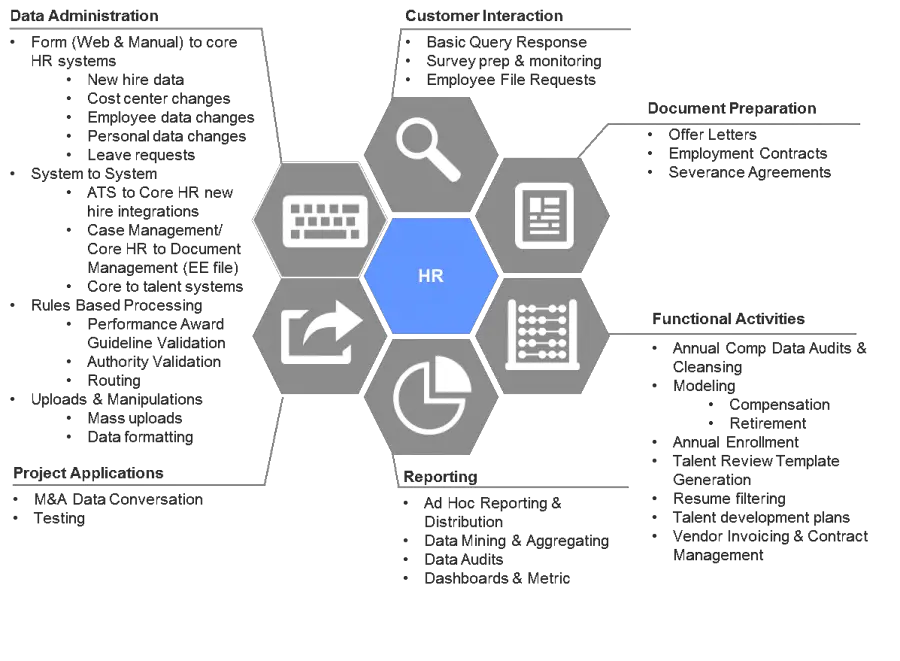
HR Workflow Diagram -

Pie Chart Representation -

Detailed Lungs Diagram Illustration -
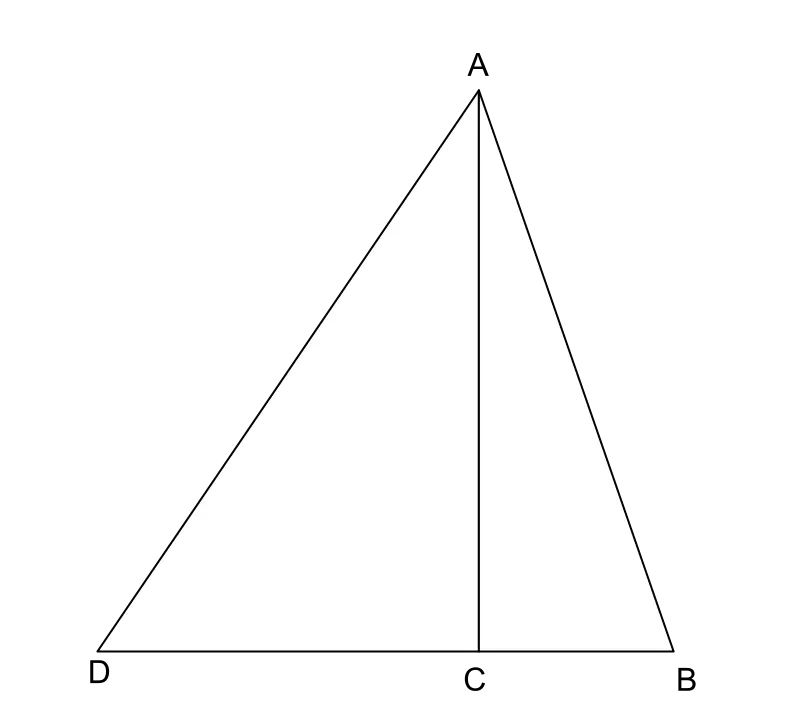
Triangle Diagram for Geometric Representation -

Abstract Circle Design -

Colorful Lion Head Illustration with Circle Patterns -

Timeline Infographic Design -

Elegant Jewelry Set with Necklace and Earrings -
Colorful Rubik's Cube Puzzle -
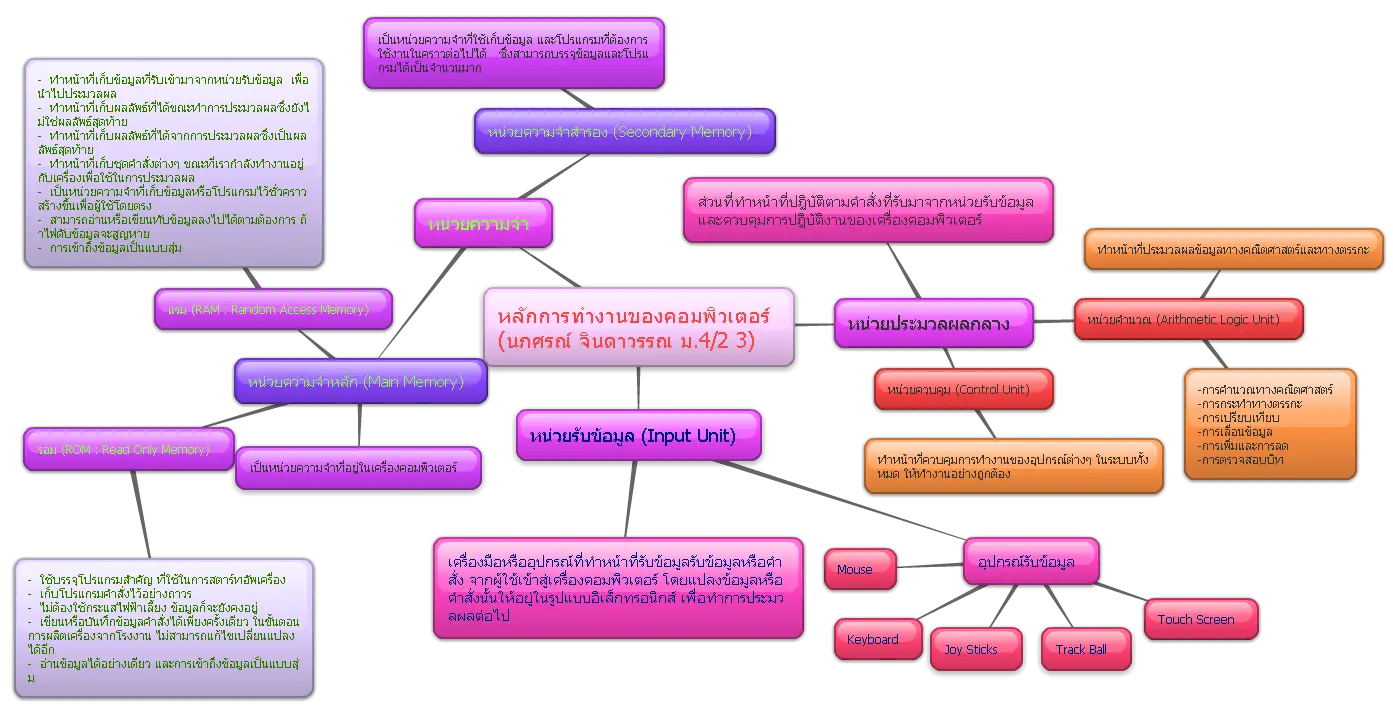
Mind Map Diagram in Colorful Design -

Abstract Colorful Concentric Circles Pattern -

Green Flowchart Diagram -
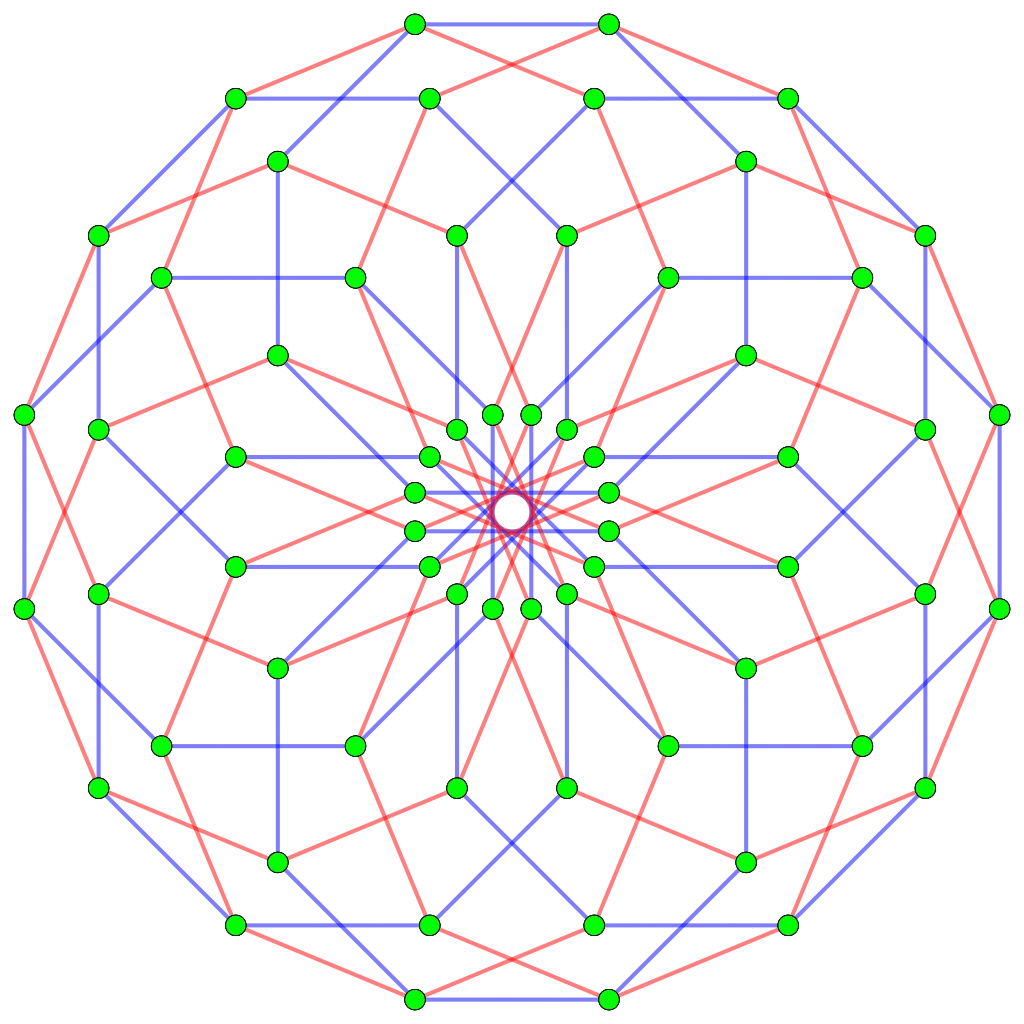
Mathematical Network Diagram with Nodes and Lines -
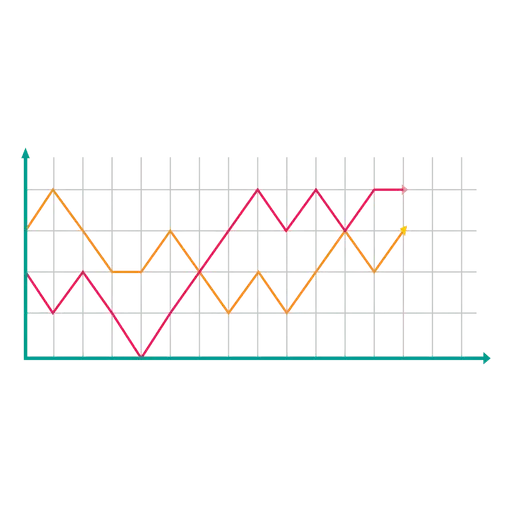
Line Graph for Data Visualization -

Colorful Puzzle Toy -
Colorful Concentric Circles Pattern -
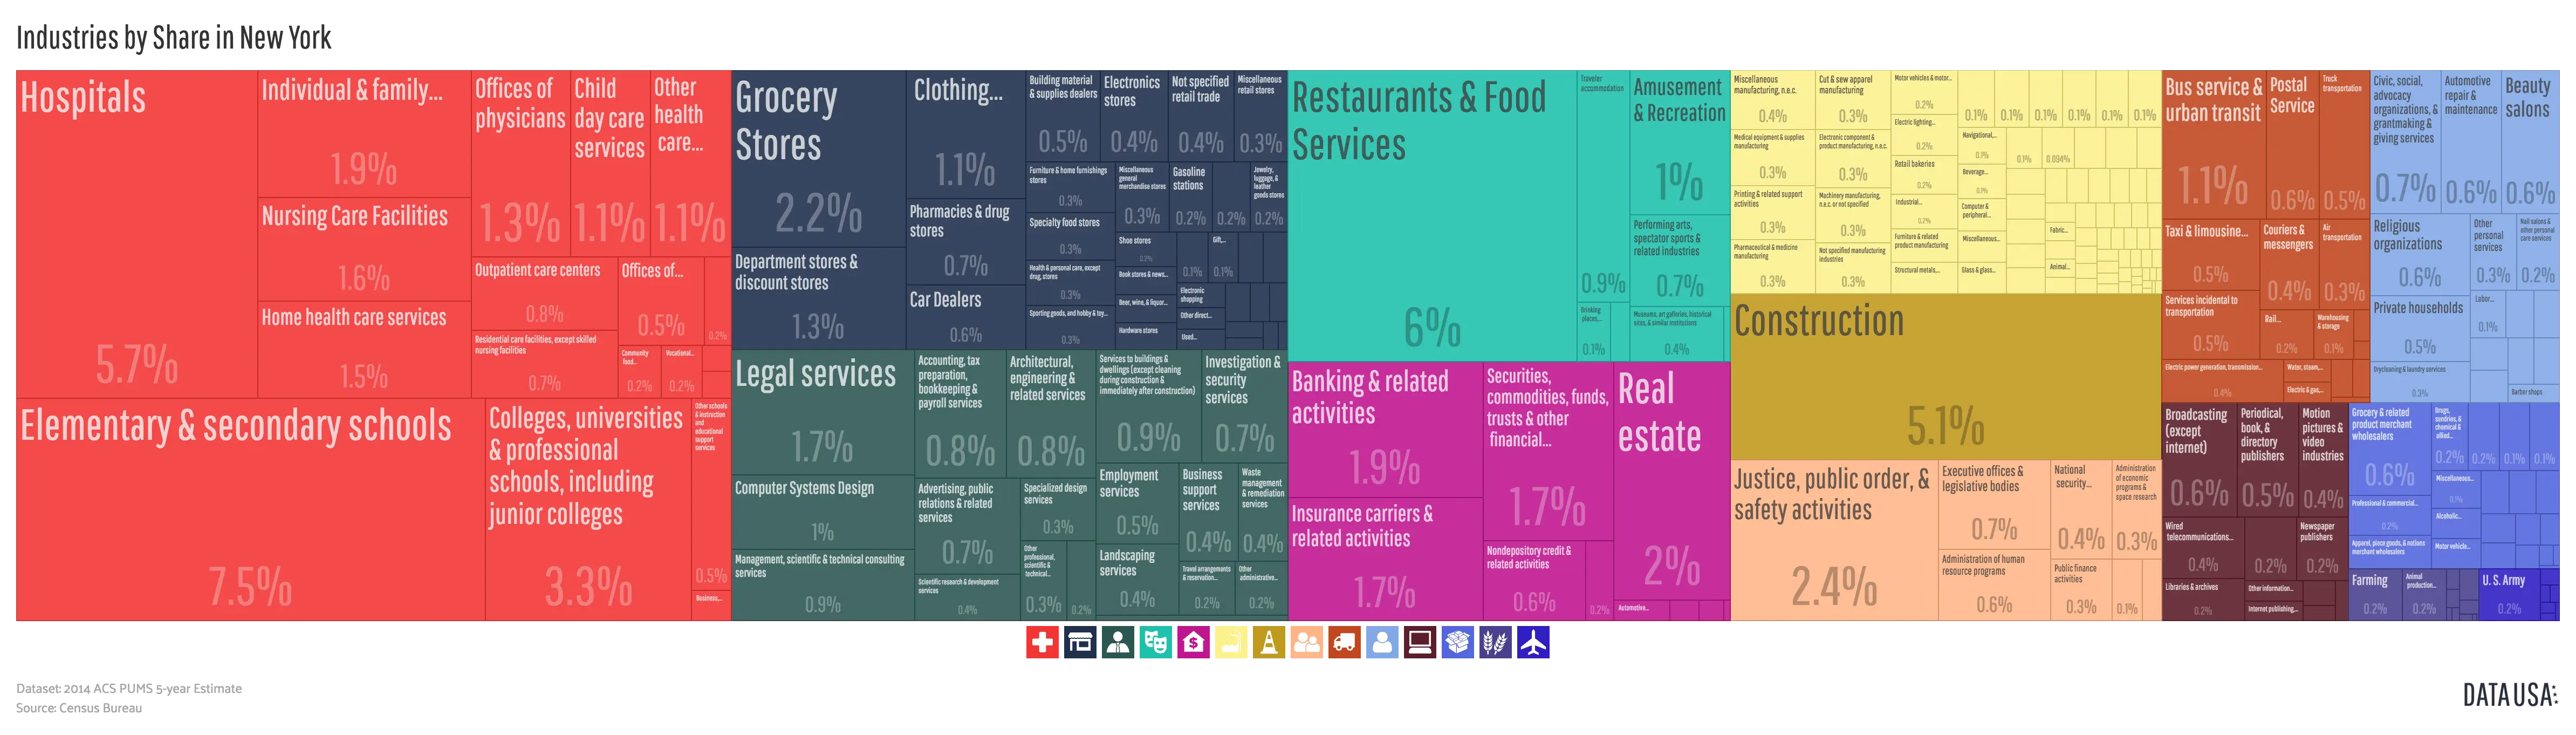
Colorful Infographic Data Visualization