Comparative Visualization of Sinc Functions, sin(x)/x and sin(πx)/(πx) on a Mathematical Line Graph
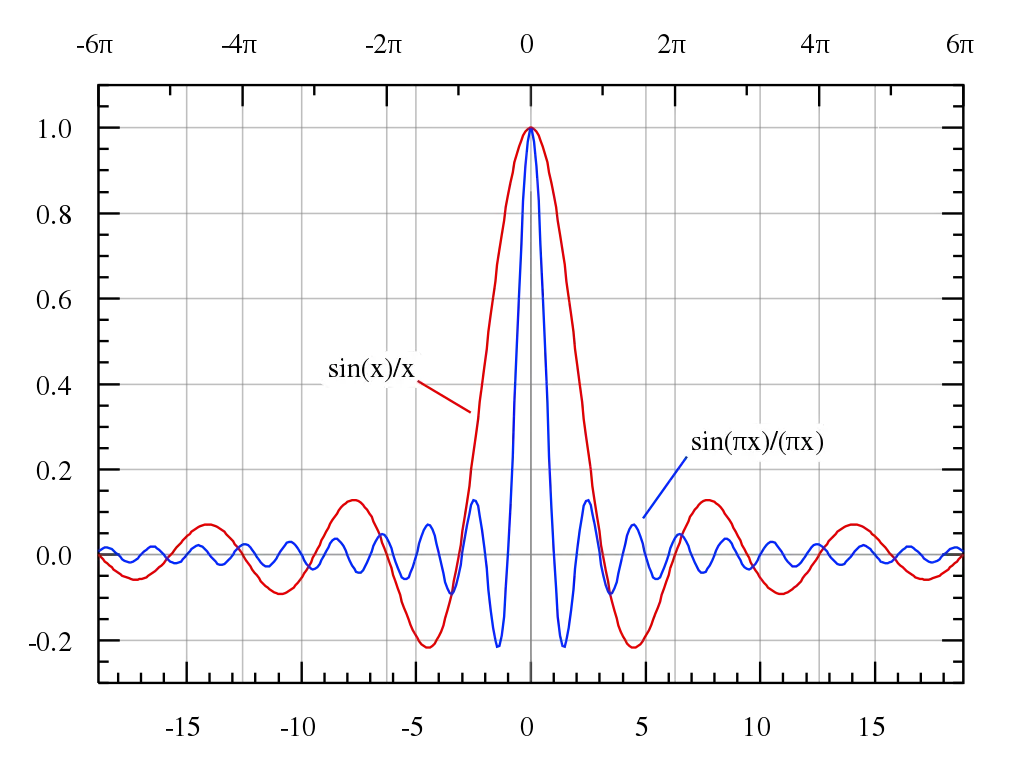
Mathematical Line Graph Representation
A clear mathematical line graph showcasing the distinct behaviors of two important sinc functions: sin(x)/x and sin(πx)/(πx). The red curve plots sin(x)/x, demonstrating its characteristic decaying oscillations with zeros at multiples of pi, while the blue curve illustrates sin(πx)/(πx), which has more frequent oscillations and zeros at integer values. The grid background aids in observing the amplitude decay and the different periodicity of these fundamental functions.