You Might Like
-

Hand Holding Plant with Energy Symbol -

Colorful Stack of Books with Decorative Leaves -
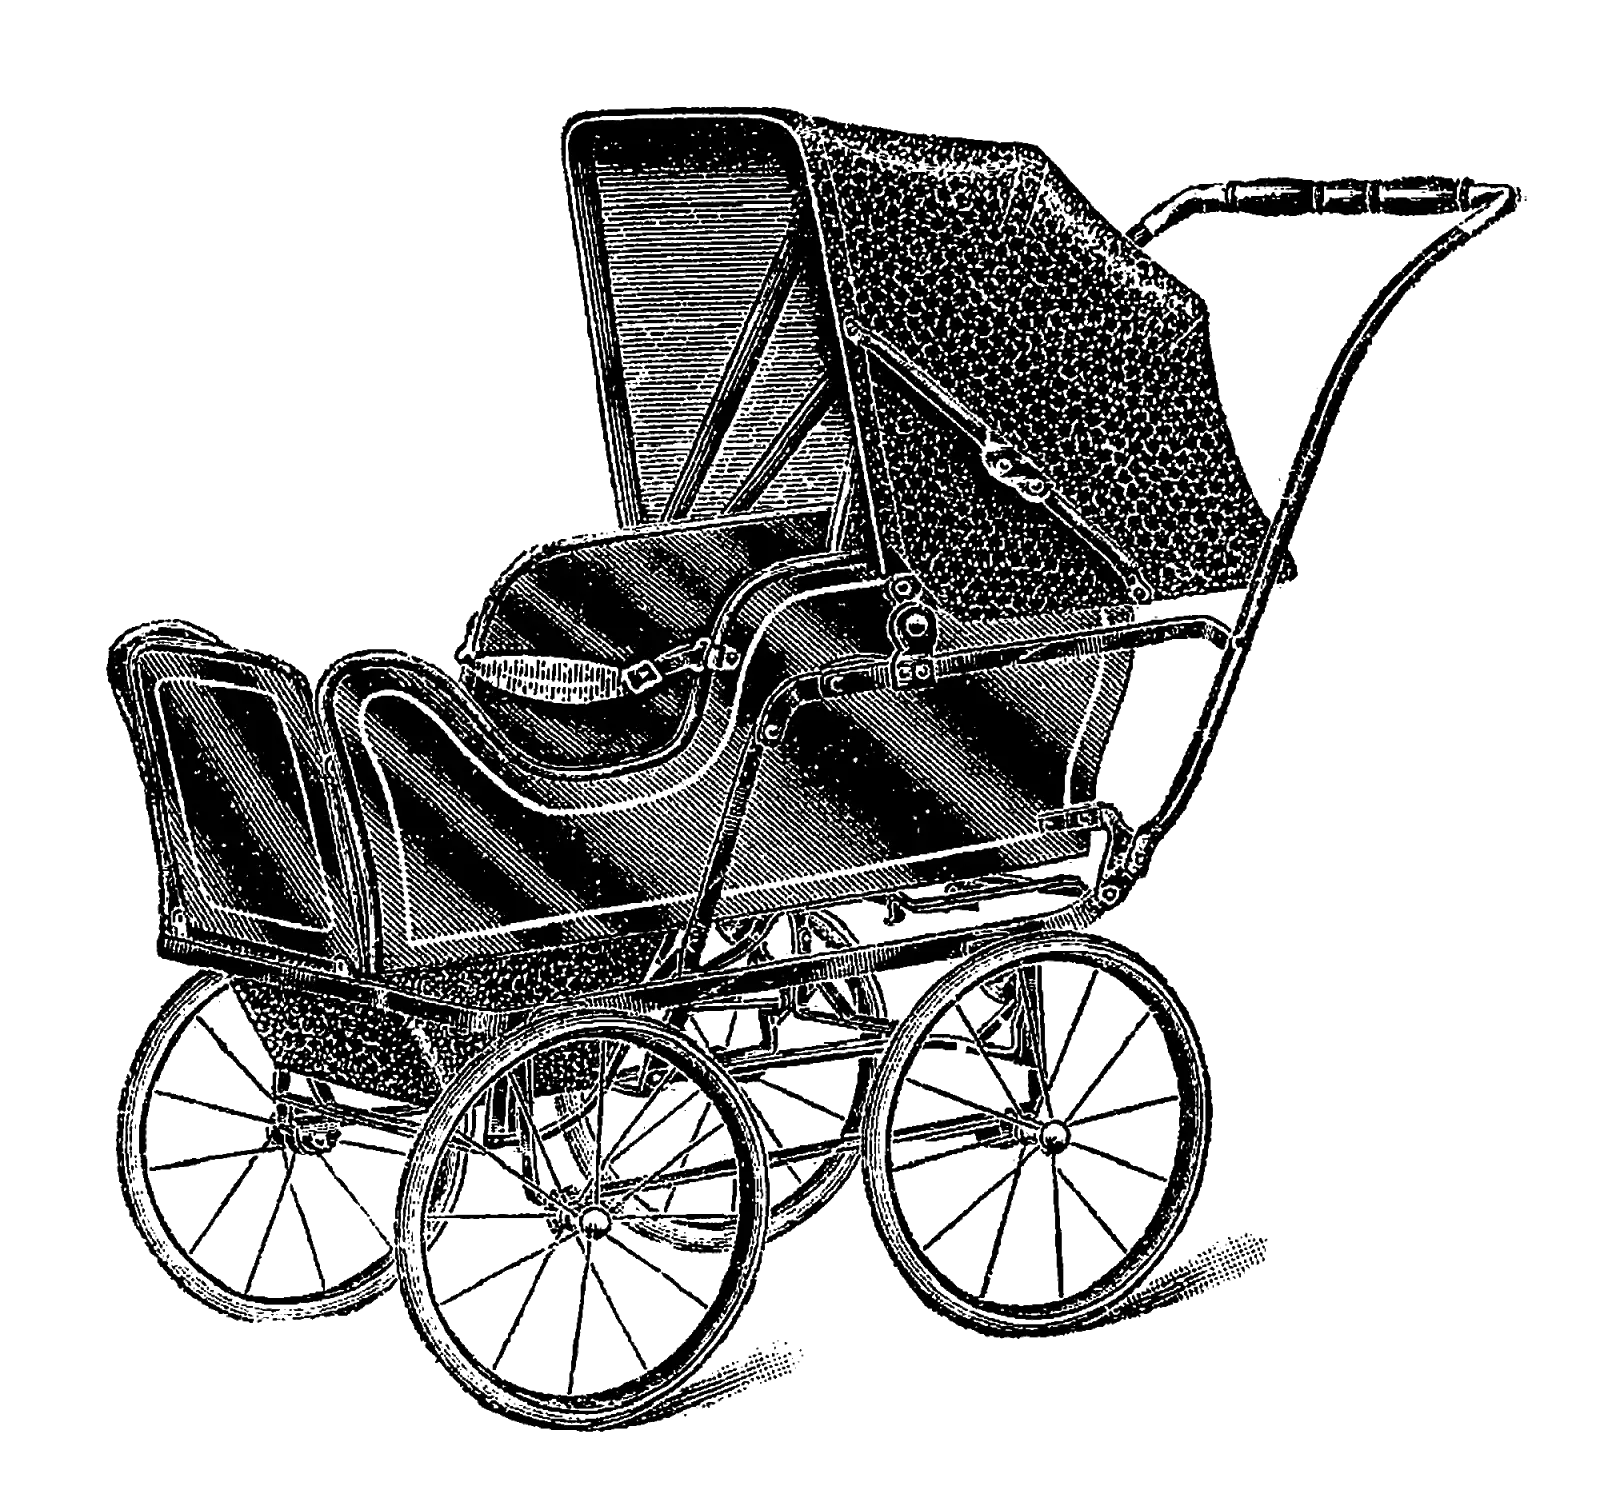
Antique Baby Stroller in Black and White -
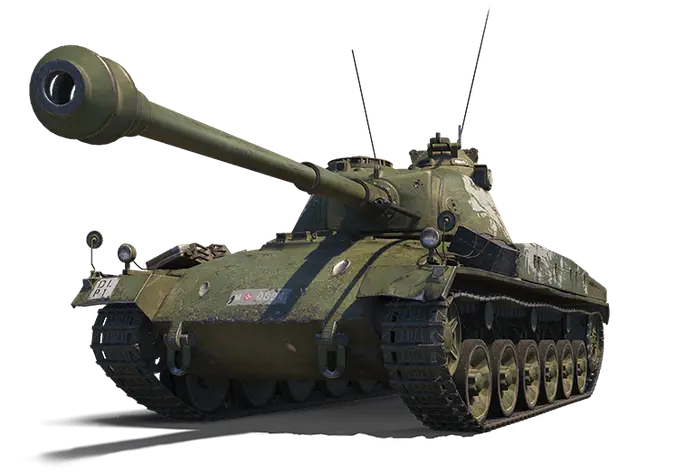
Military Tank Illustration -

Organizational Structure Chart -
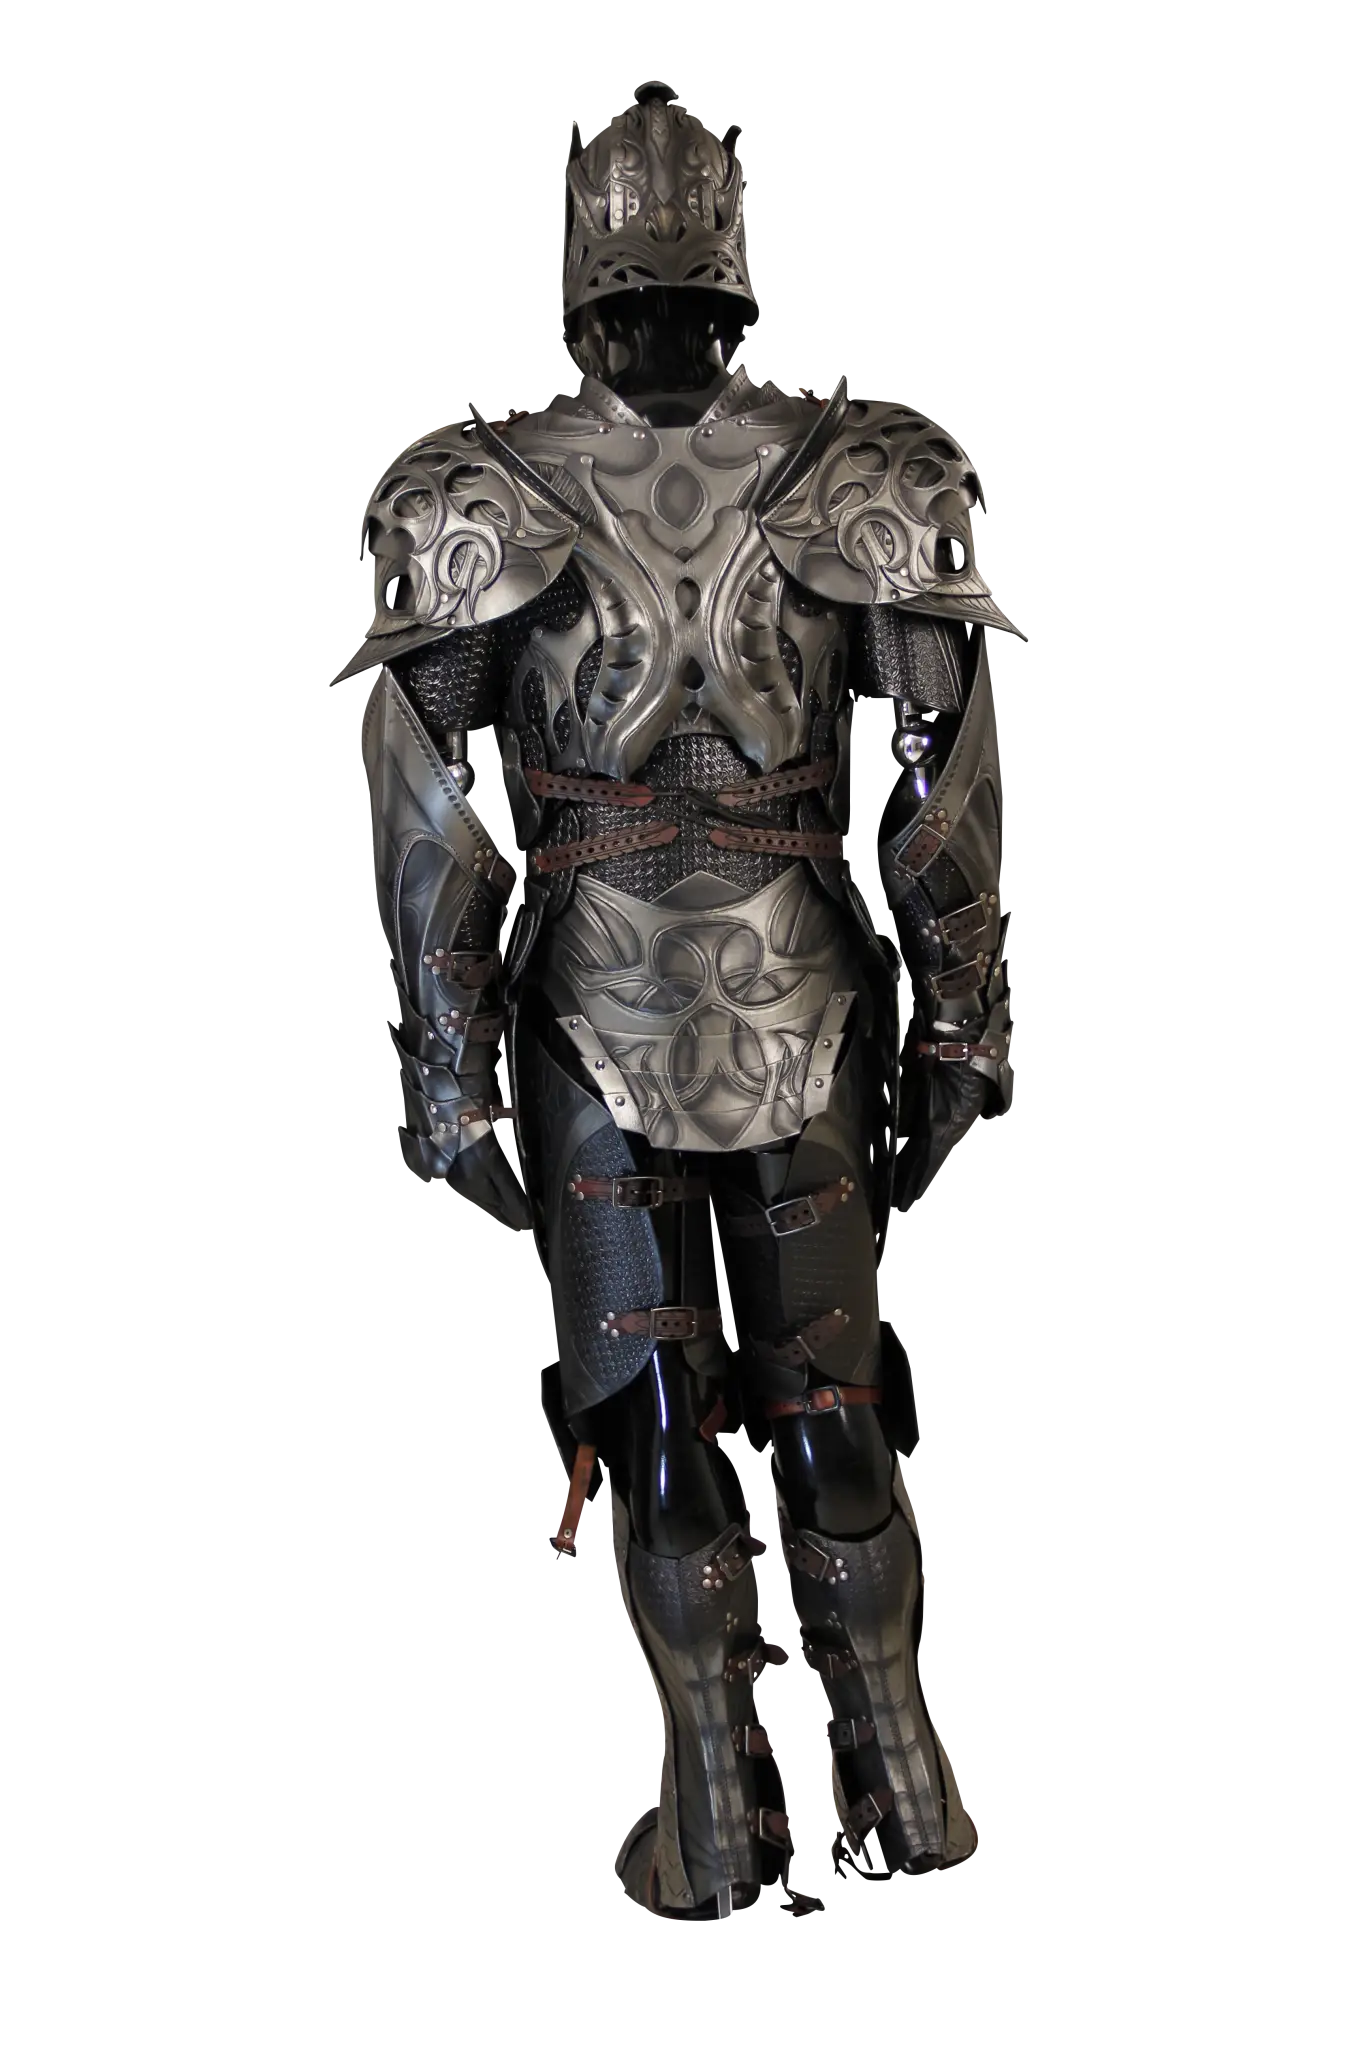
Black Medieval Armor for Historical and Fantasy Themes -

Sun and Hands Symbol -
Decorative Black Scroll with Red Ribbons -

Black Pilgrim Hat with Buckle -

Presentation Board with Graph for Business Concepts -
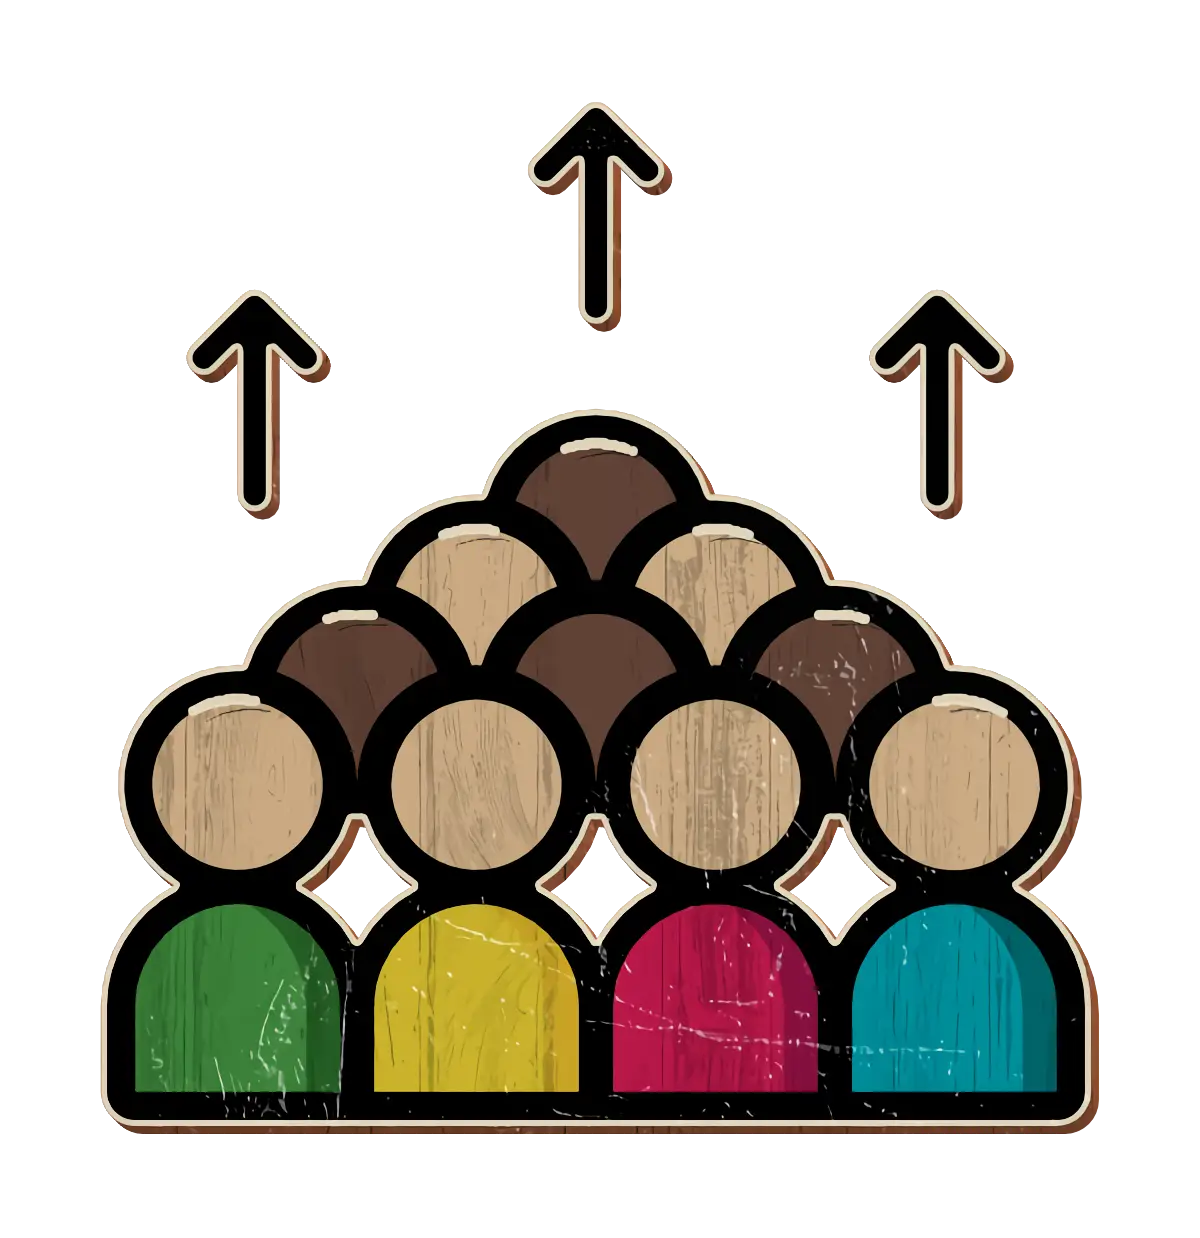
Group of People with Upward Arrows -

Bar Chart with Upward Arrow -

Infographic Pencil with Data Elements -

Dollar Sign with Circular Arrows -

Search Growth Icon -

Illustration of Growth Chart with Upward Arrow -

Business People with Circular Chart -
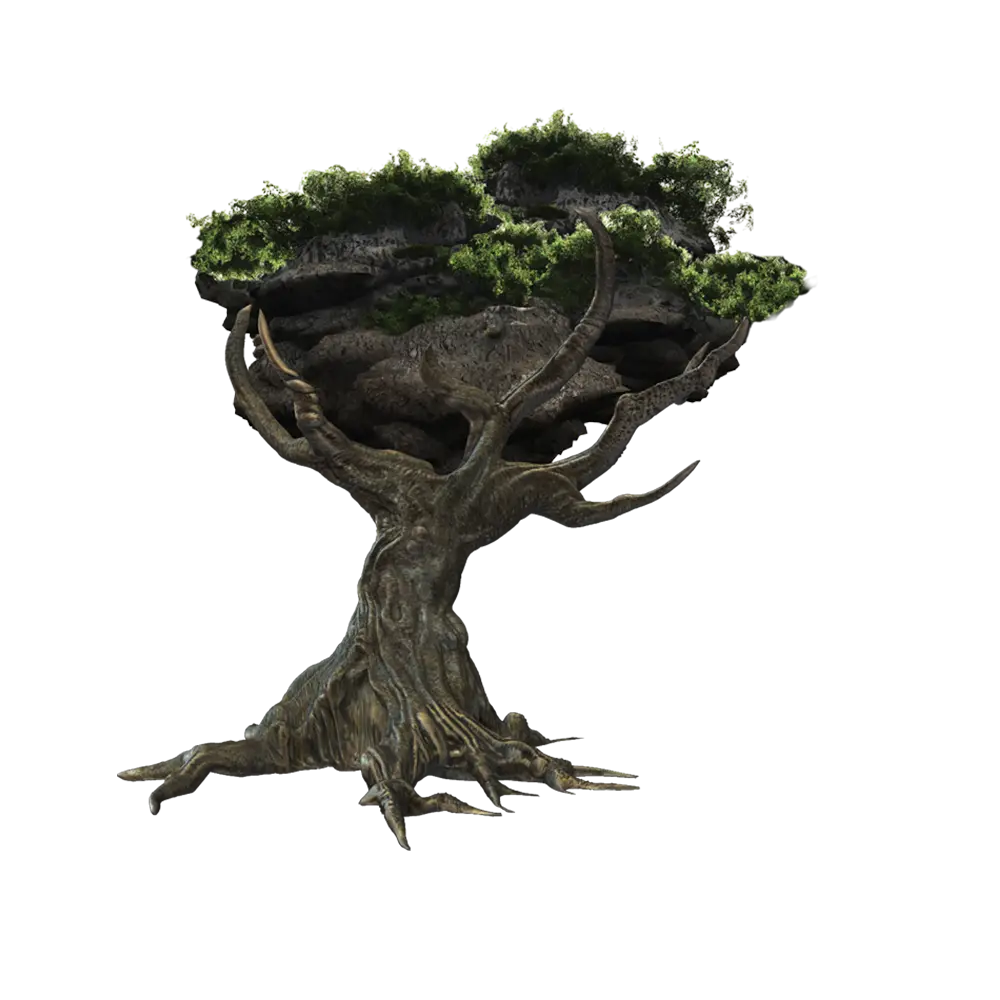
Old Tree with Branches and Leaves -
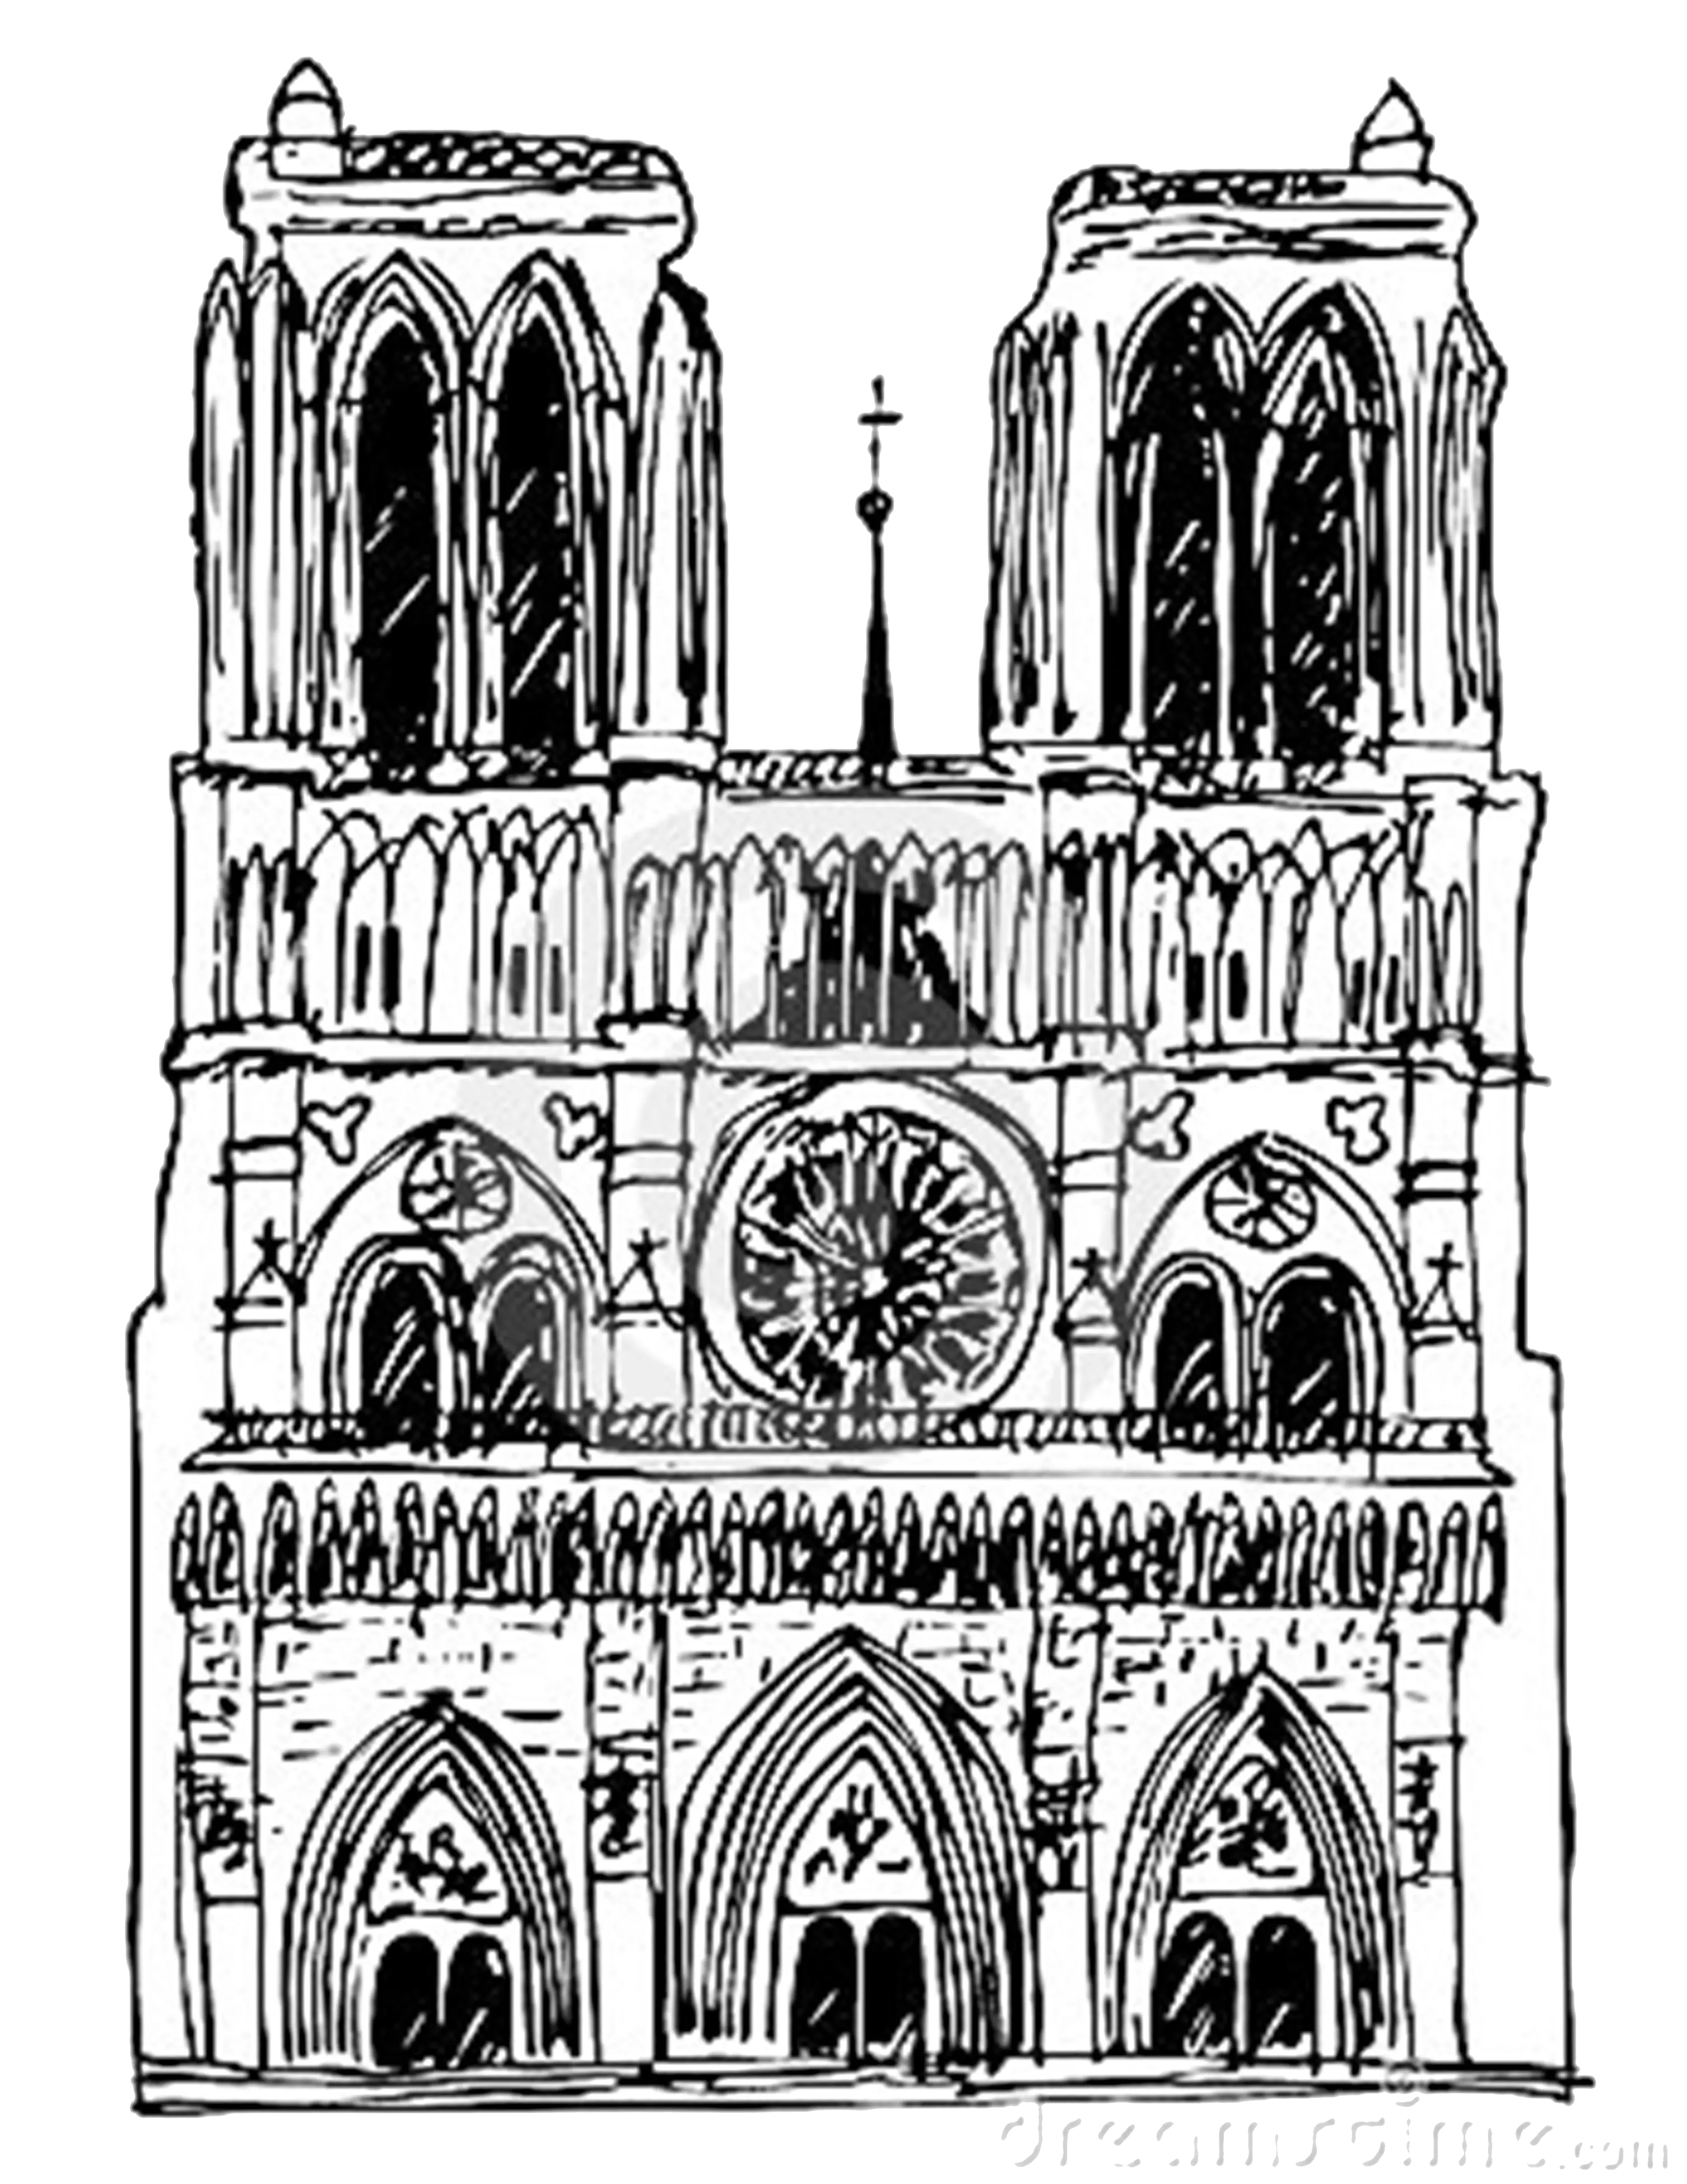
Detailed Sketch of a Cathedral -

Curved Black Upward Arrow -
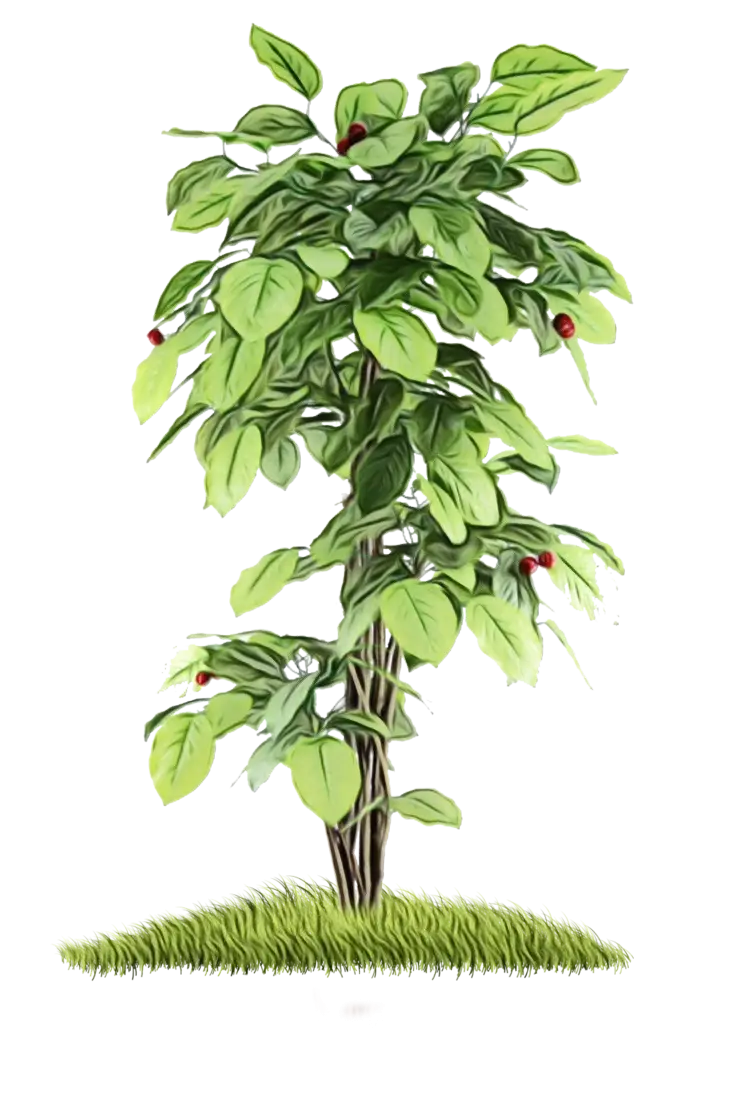
Green Tree with Red Fruits and Grass -

Pink Lotus Bud Flower -

Person Icon with Dollar Sign -
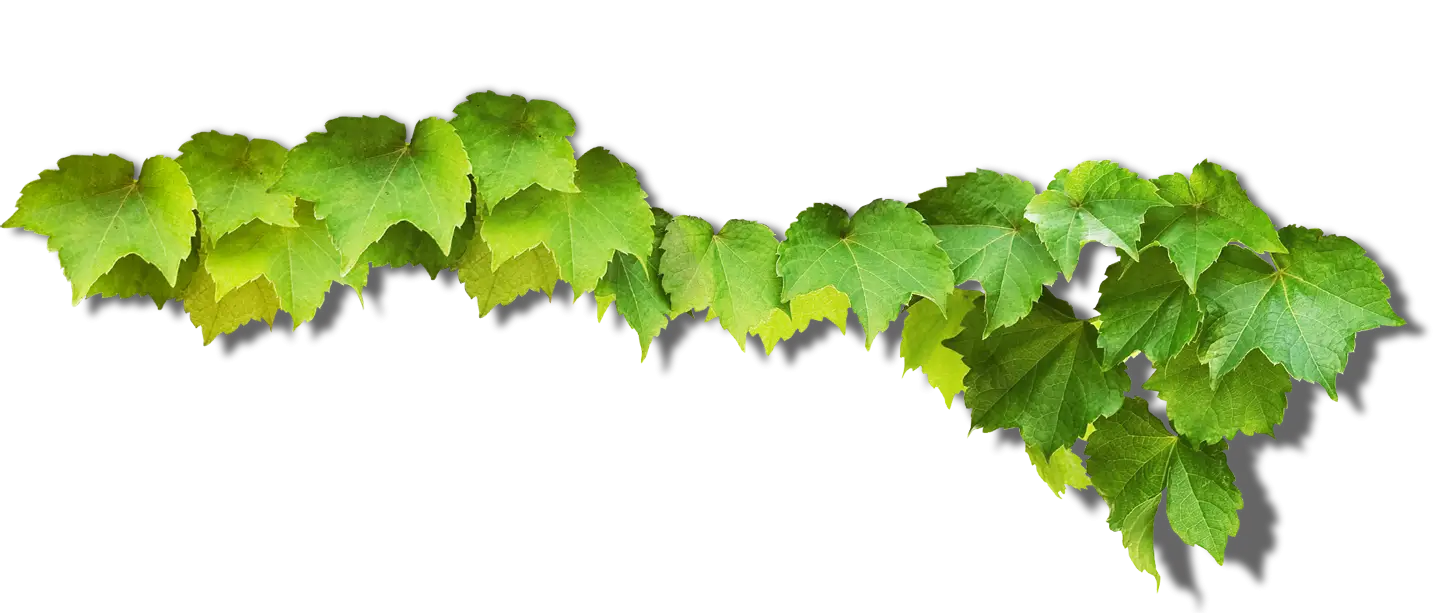
Green Vine Leaves -

Blue Declining Bar Graph with Arrow -
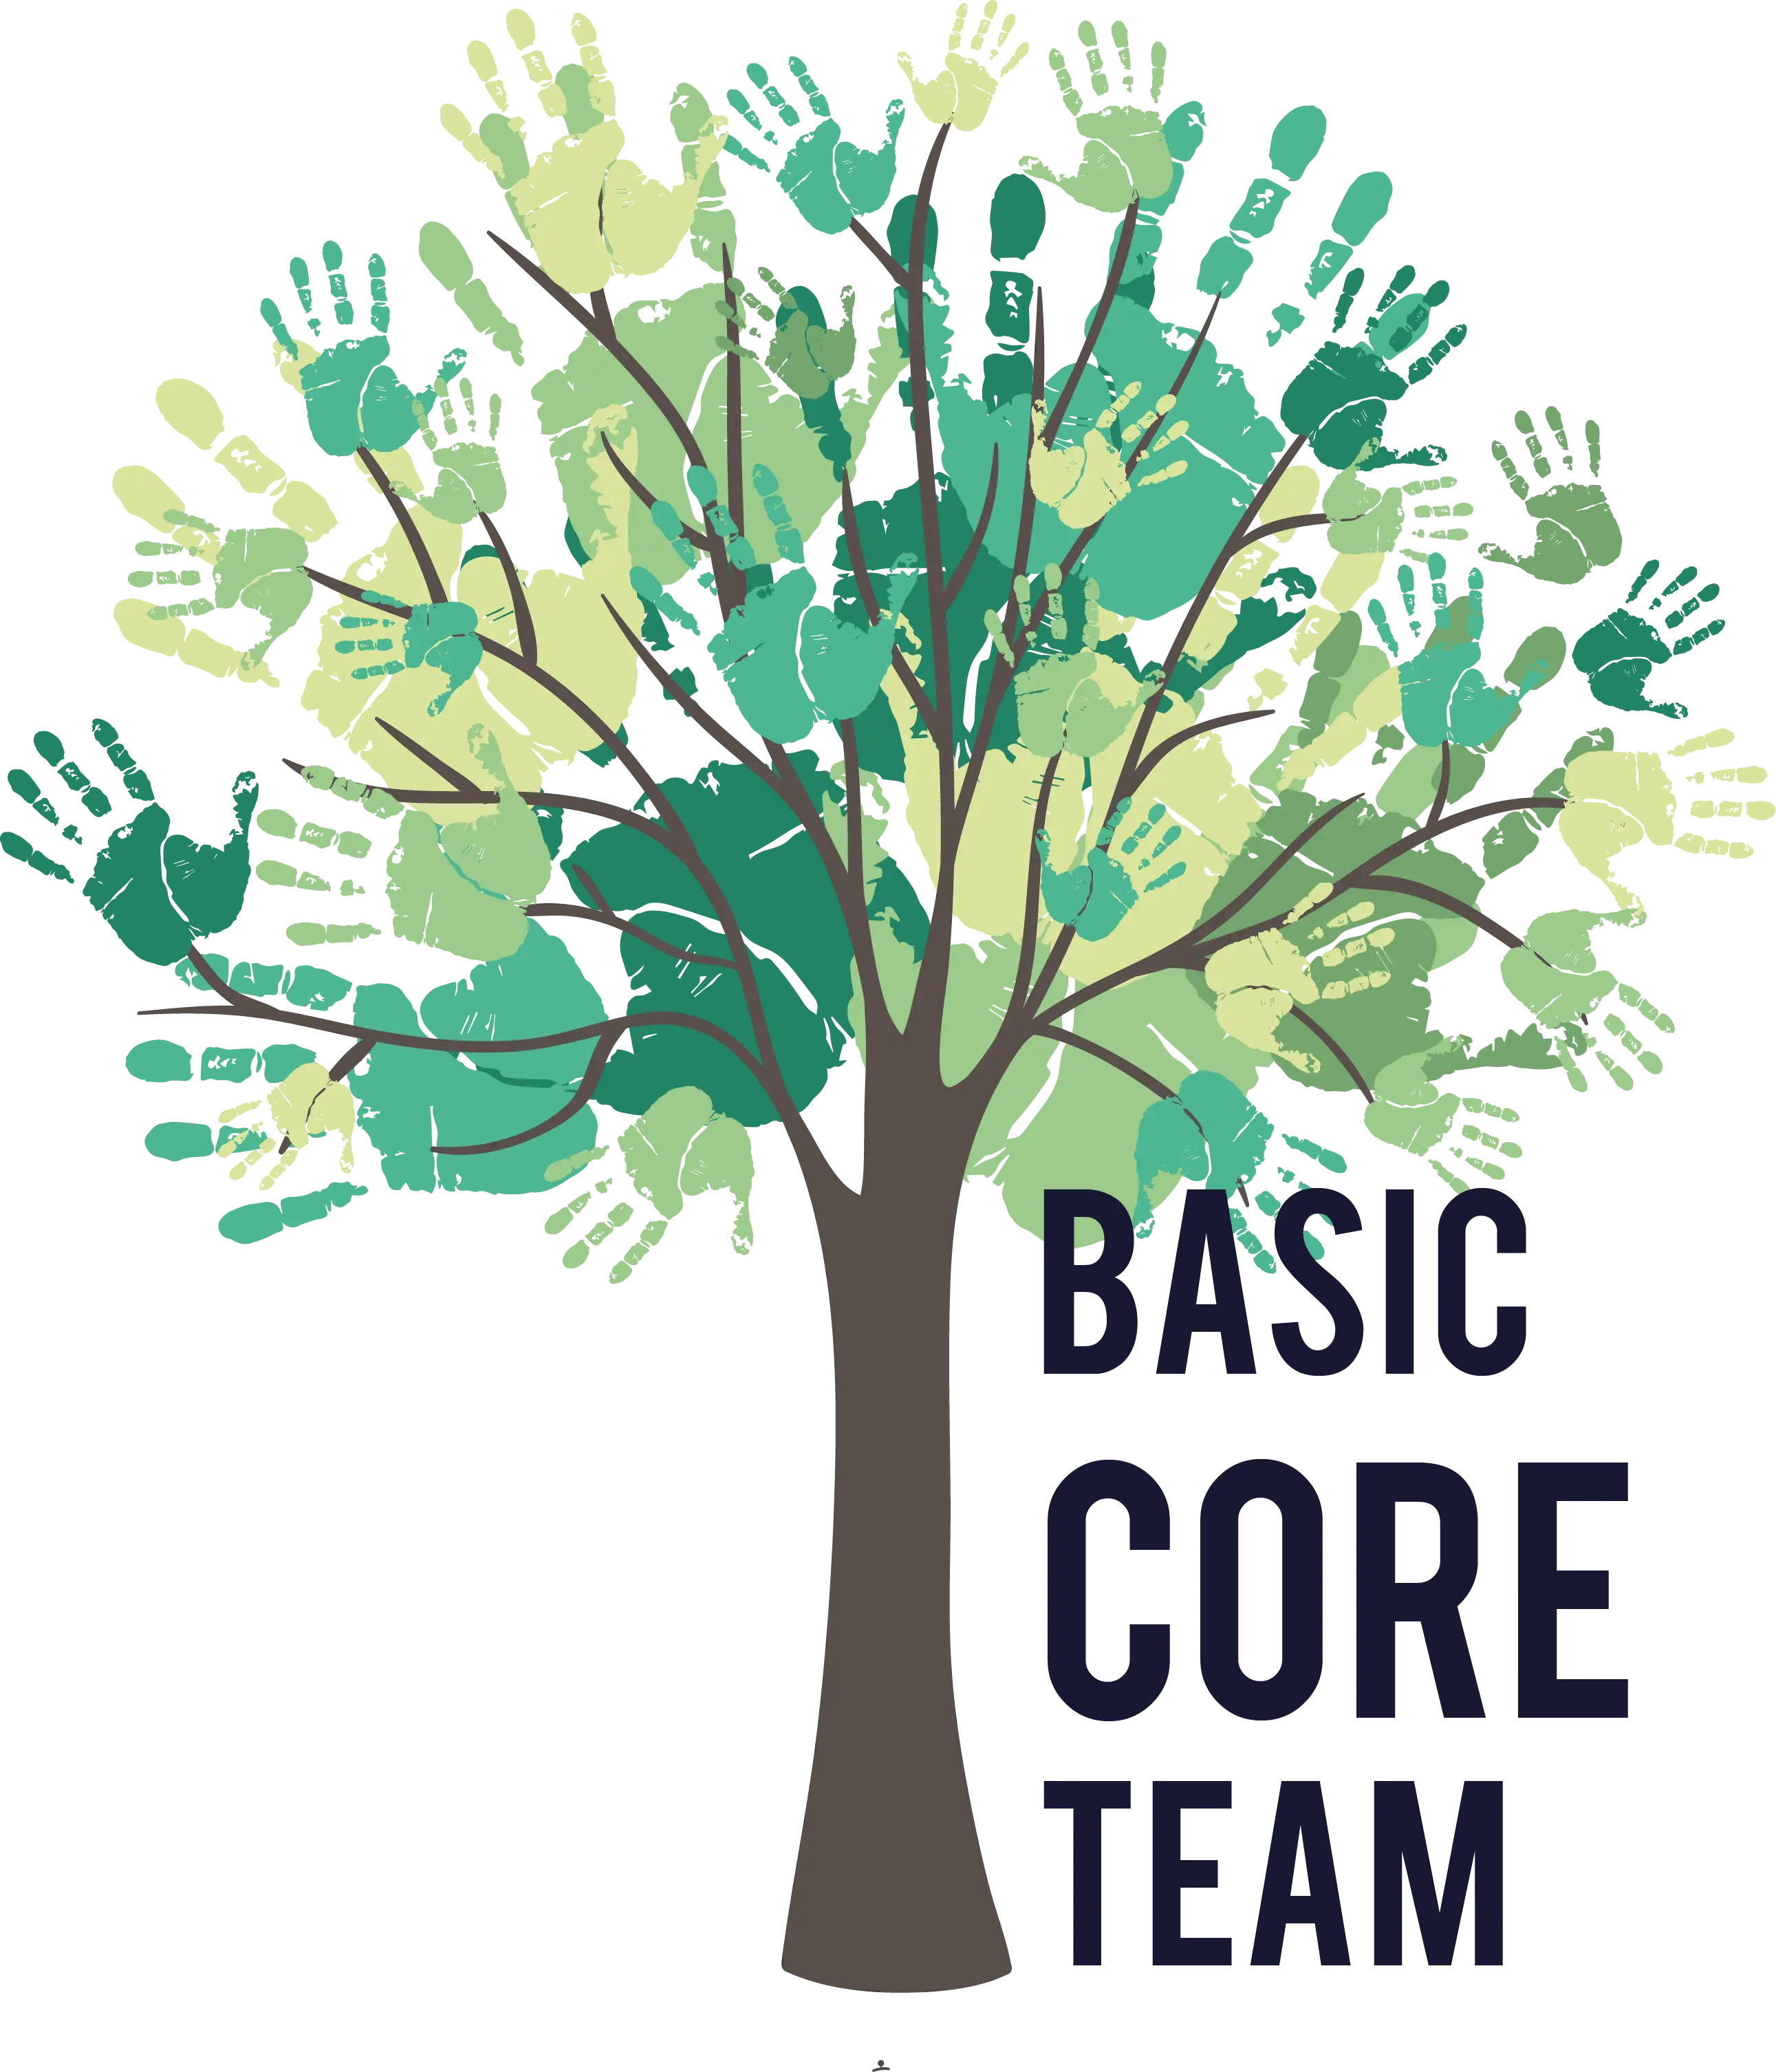
Tree with Handprints for Team Collaboration -

Circle Pie Chart Icon -
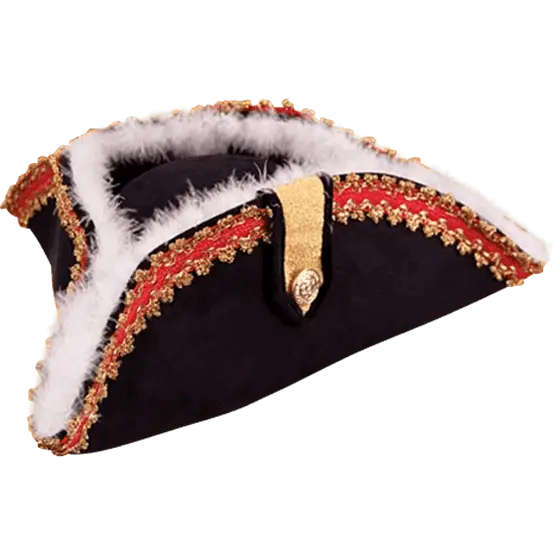
Decorative Pirate Hat -

Bull Market Symbol -

House with Dollar Sign Symbol