
You Might Like
-

Brown Mat for Home -

Baseball Player Swinging Bat -

Mathematical Geometry and Graph Concepts -

Cartoon Police Officer in Uniform -

Innovative Light Bulb Illustration -

Ice Hockey Player in Red Uniform -

Zigzag Down Arrow Icon for Decline Representation -

Transportation Logistics with Global Shipment -

Cartoon Worker with Ladder and Tools -

Infographic Pencil with Data Elements -

Graph Plot with Blue Curve Illustration -

Red Light Bulb Cartoon -

Yellow Light Bulb Sketch -

Police Officer Character Illustration with Gun -

Soccer Player in Green Uniform Running -

Waiter in Uniform -
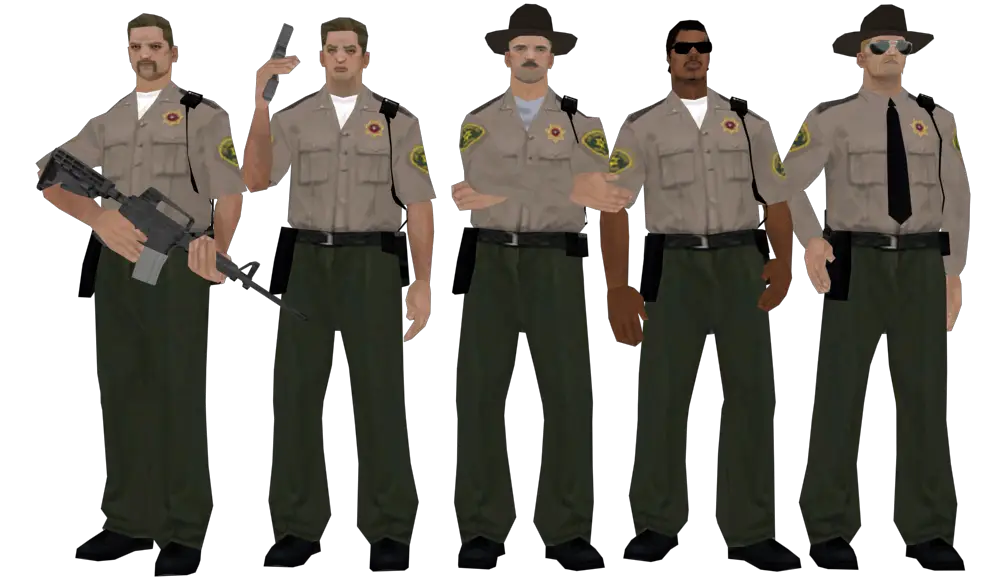
Group of Police Officers -

3D Coordinate System Illustration -

Blue Declining Bar Graph with Arrow -

Circle Pie Chart Icon -
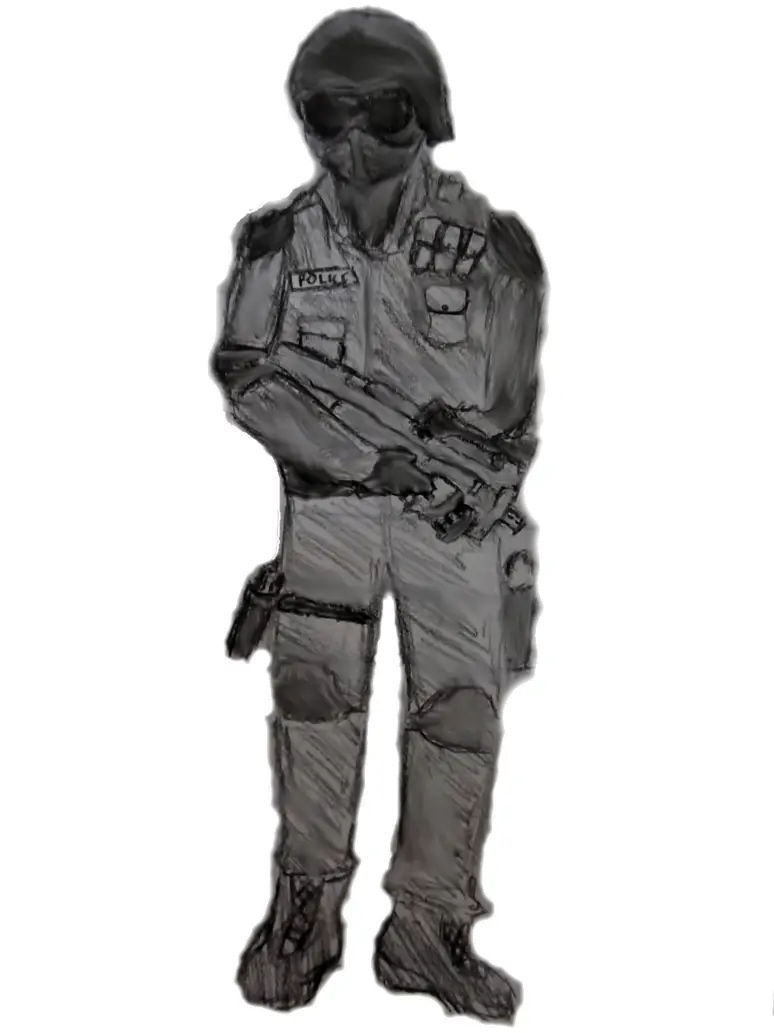
Police Officer Sketch -

Cleaner in Uniform with Mop -

Illustration of a Baseball Player in Uniform -

Mathematical Formula Equation -

Traditional Abacus for Calculation and Learning -

Declining Chart Illustration -

34,046 CPS Appointments Text -

Future Box Logo with Globe -

Pie Chart Representation -

Light Bulb Outline for Icons and Designs