You Might Like
-

Business Strategy Icons -

Organizational Structure Chart -

Yellow Circular Arrow Symbol for Recycling -

Bar Chart with Upward Arrow -

Industrial Valve System Design -

Dollar Sign with Circular Arrows -
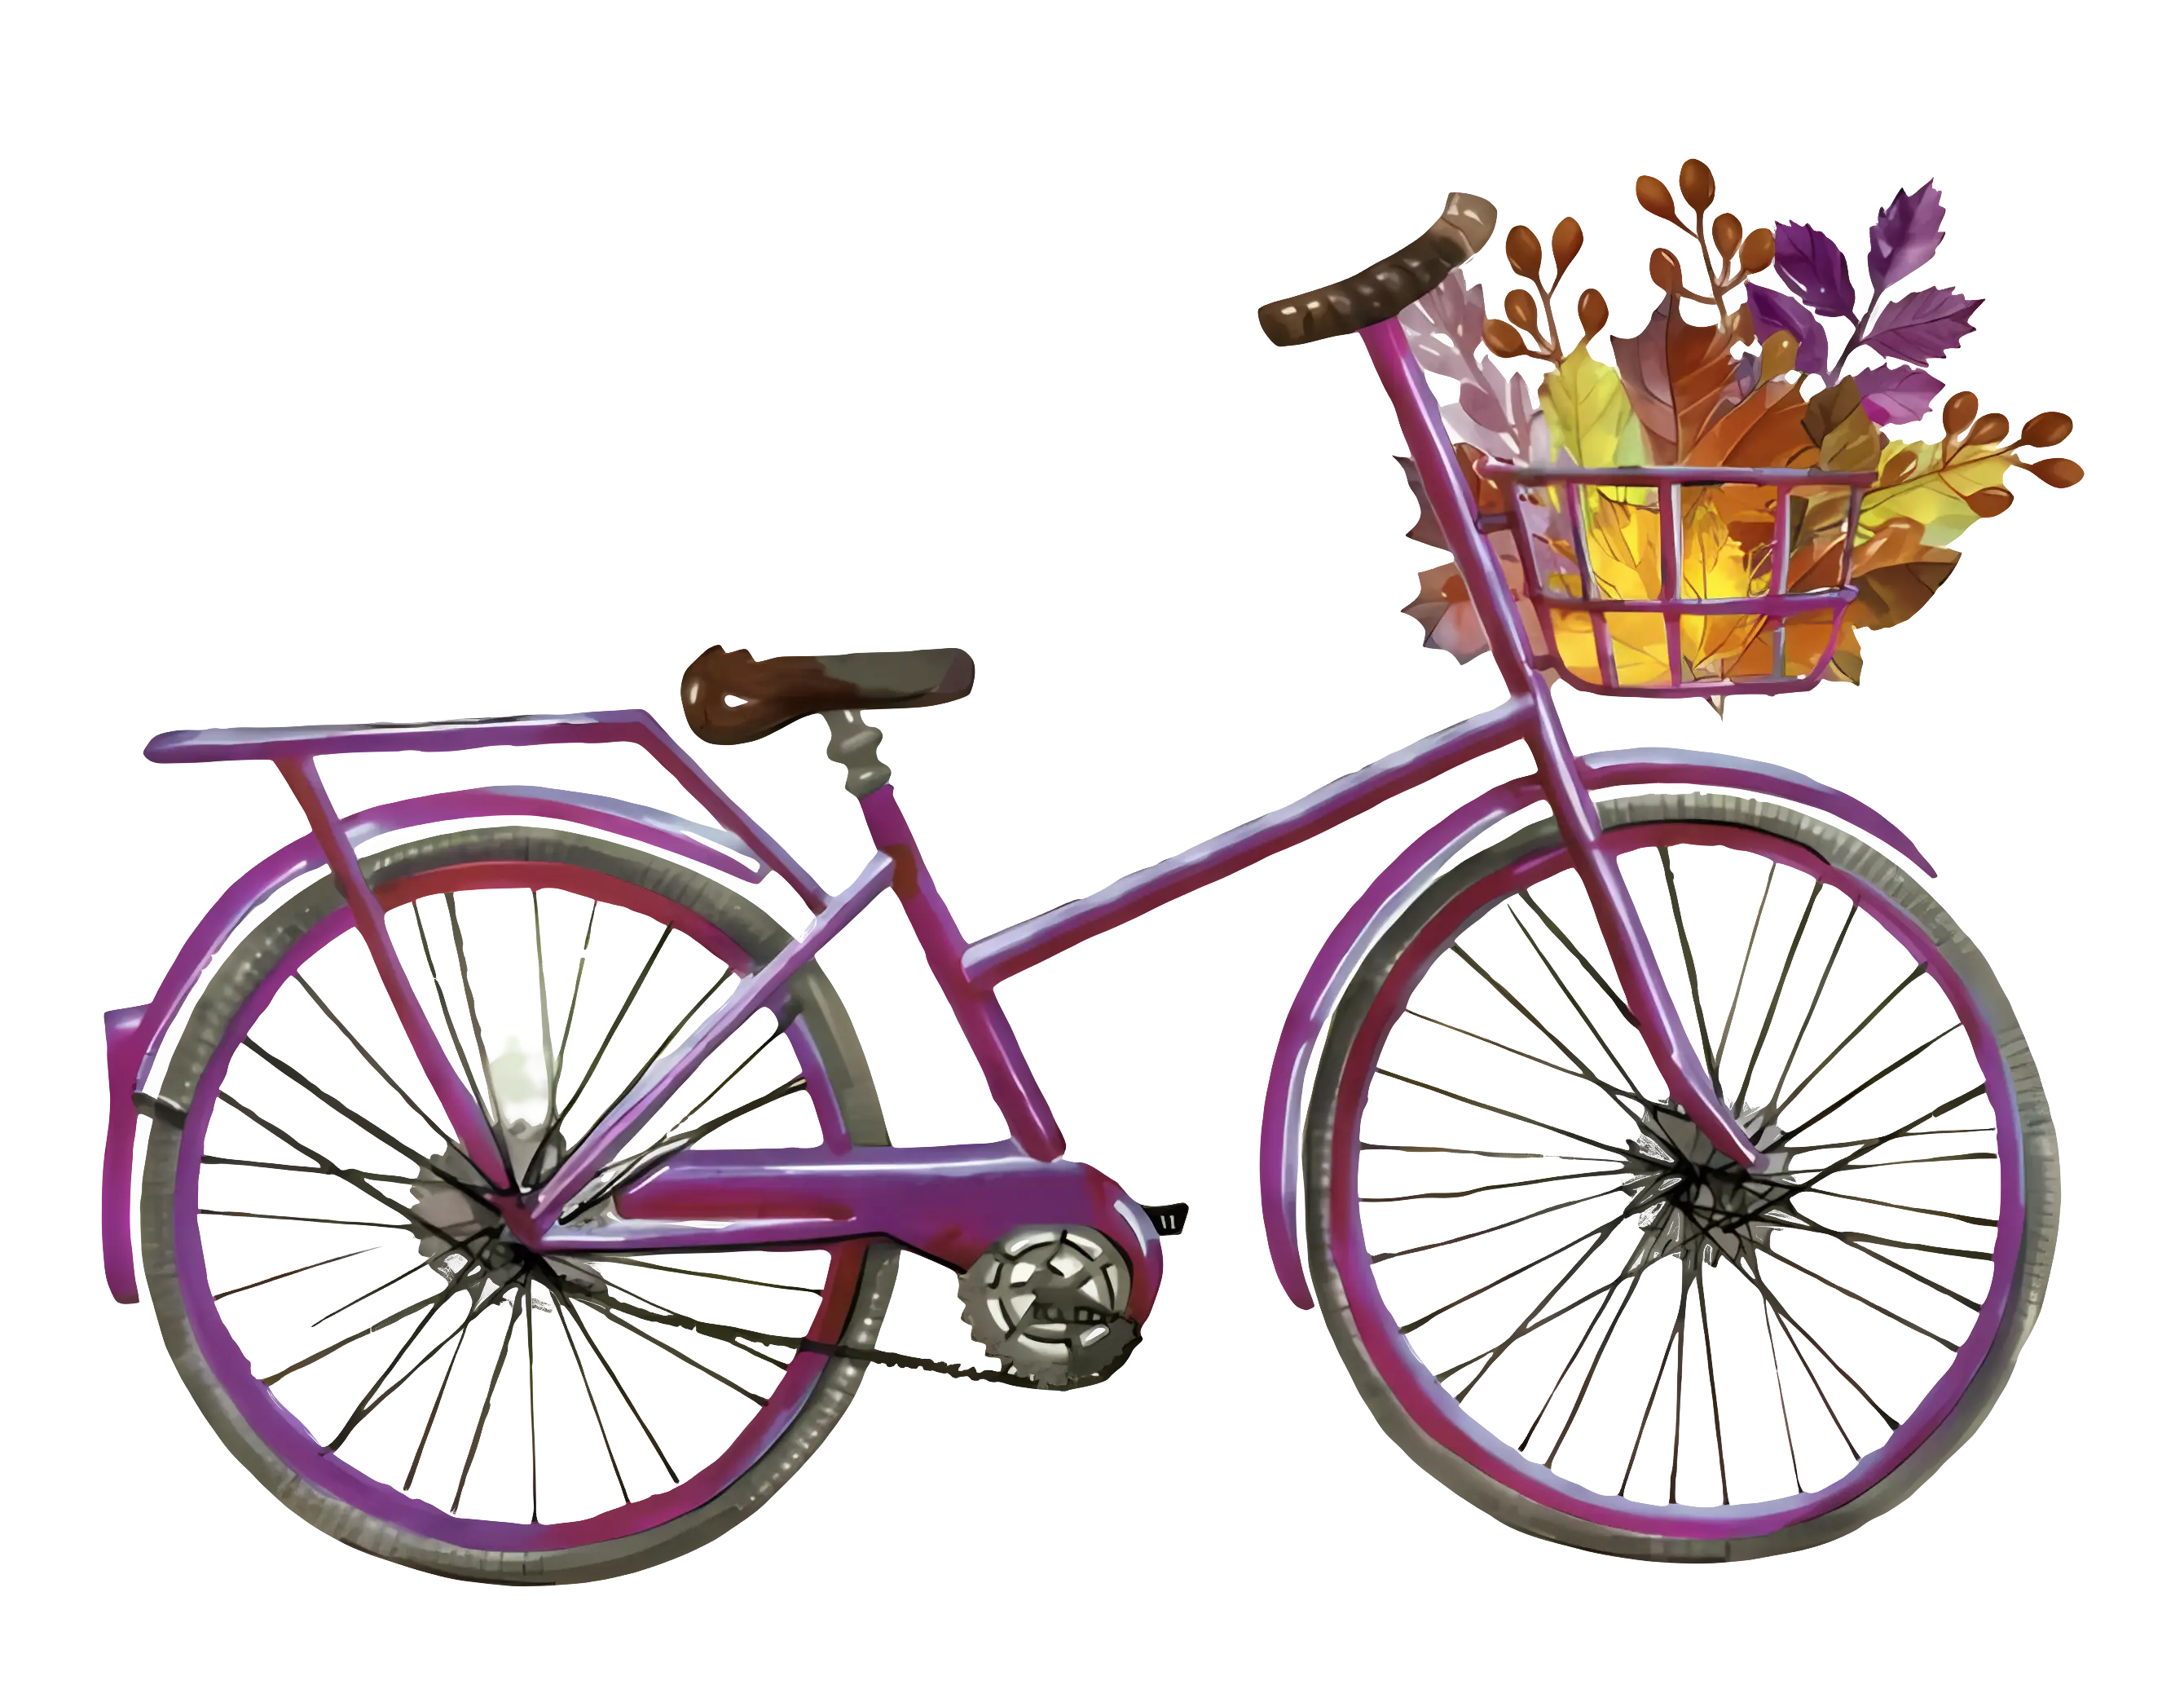
Purple Bicycle with Autumn Leaves in Basket -

Illustration of Growth Chart with Upward Arrow -

Precision Hardness Tester for Materials -

Business People with Circular Chart -

Circular Arrows Representing Cycle or Loop -
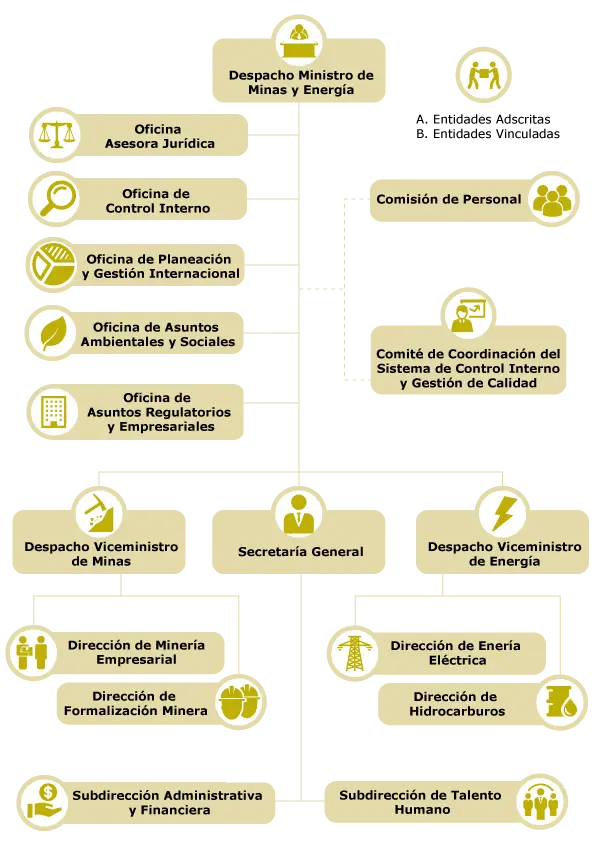
Ministry of Mines and Energy Organizational Chart -

Business Icons Set for Digital Workflows -
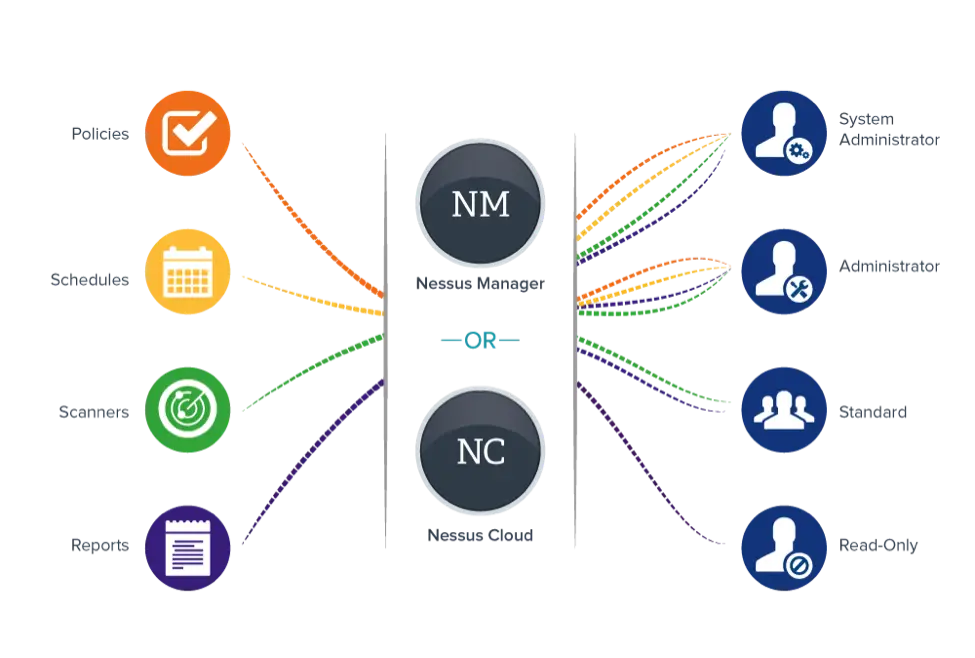
Nexus Manager Flowchart -

HR Workflow Diagram -
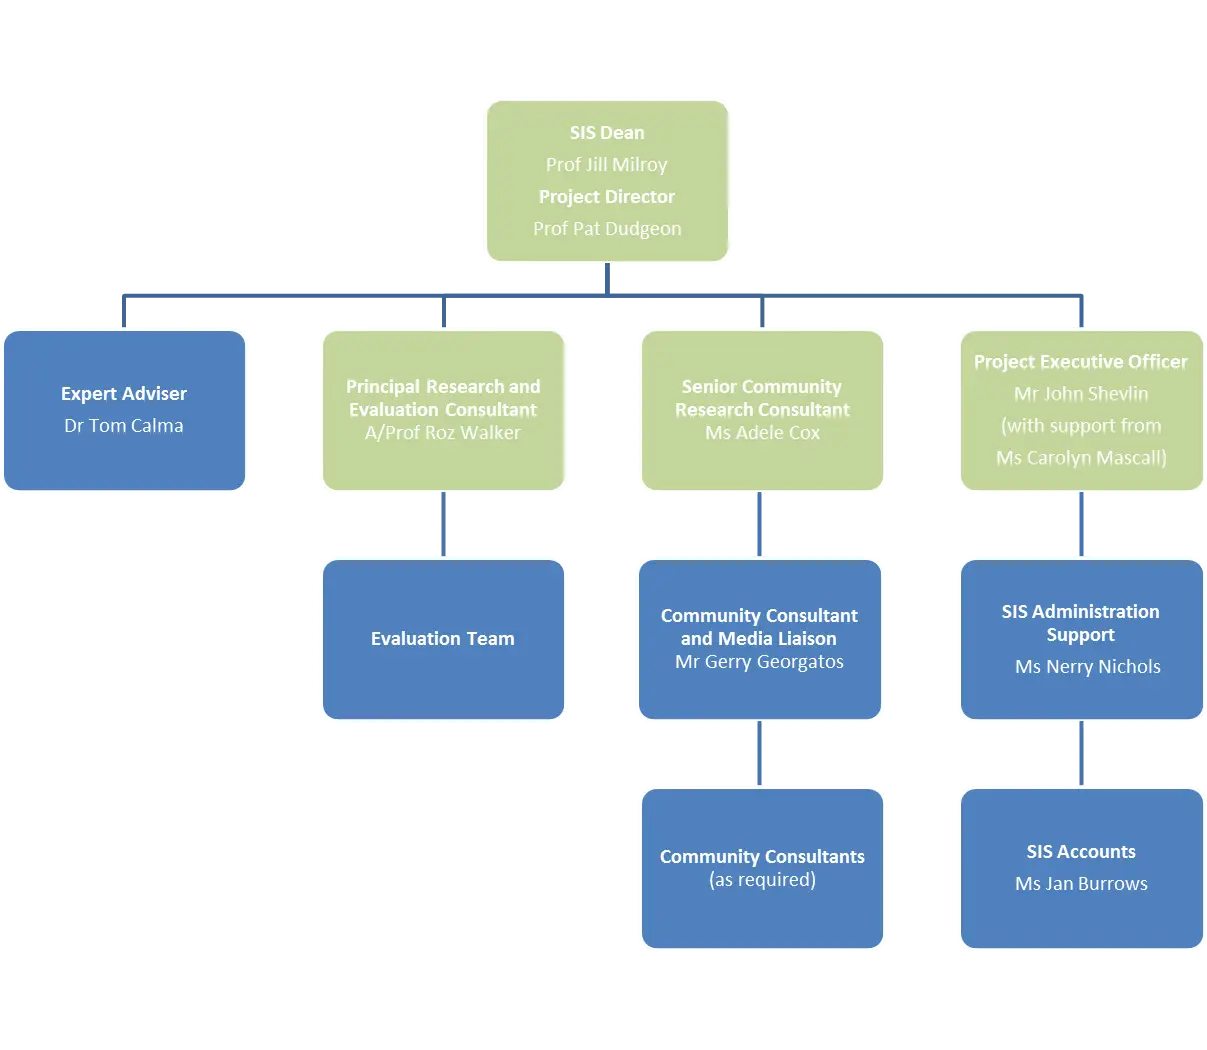
Organizational Flowchart Diagram -

GMP Malaysia Food Safety Certification Logo -

Allegro Commodity Management Logo -

Colorful Bicycle with Basket in Pastel Tones -

Halal Food Certification Symbol in Green -
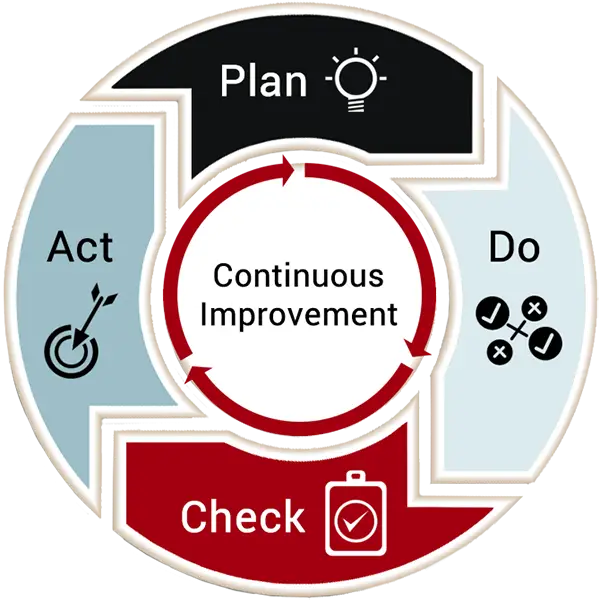
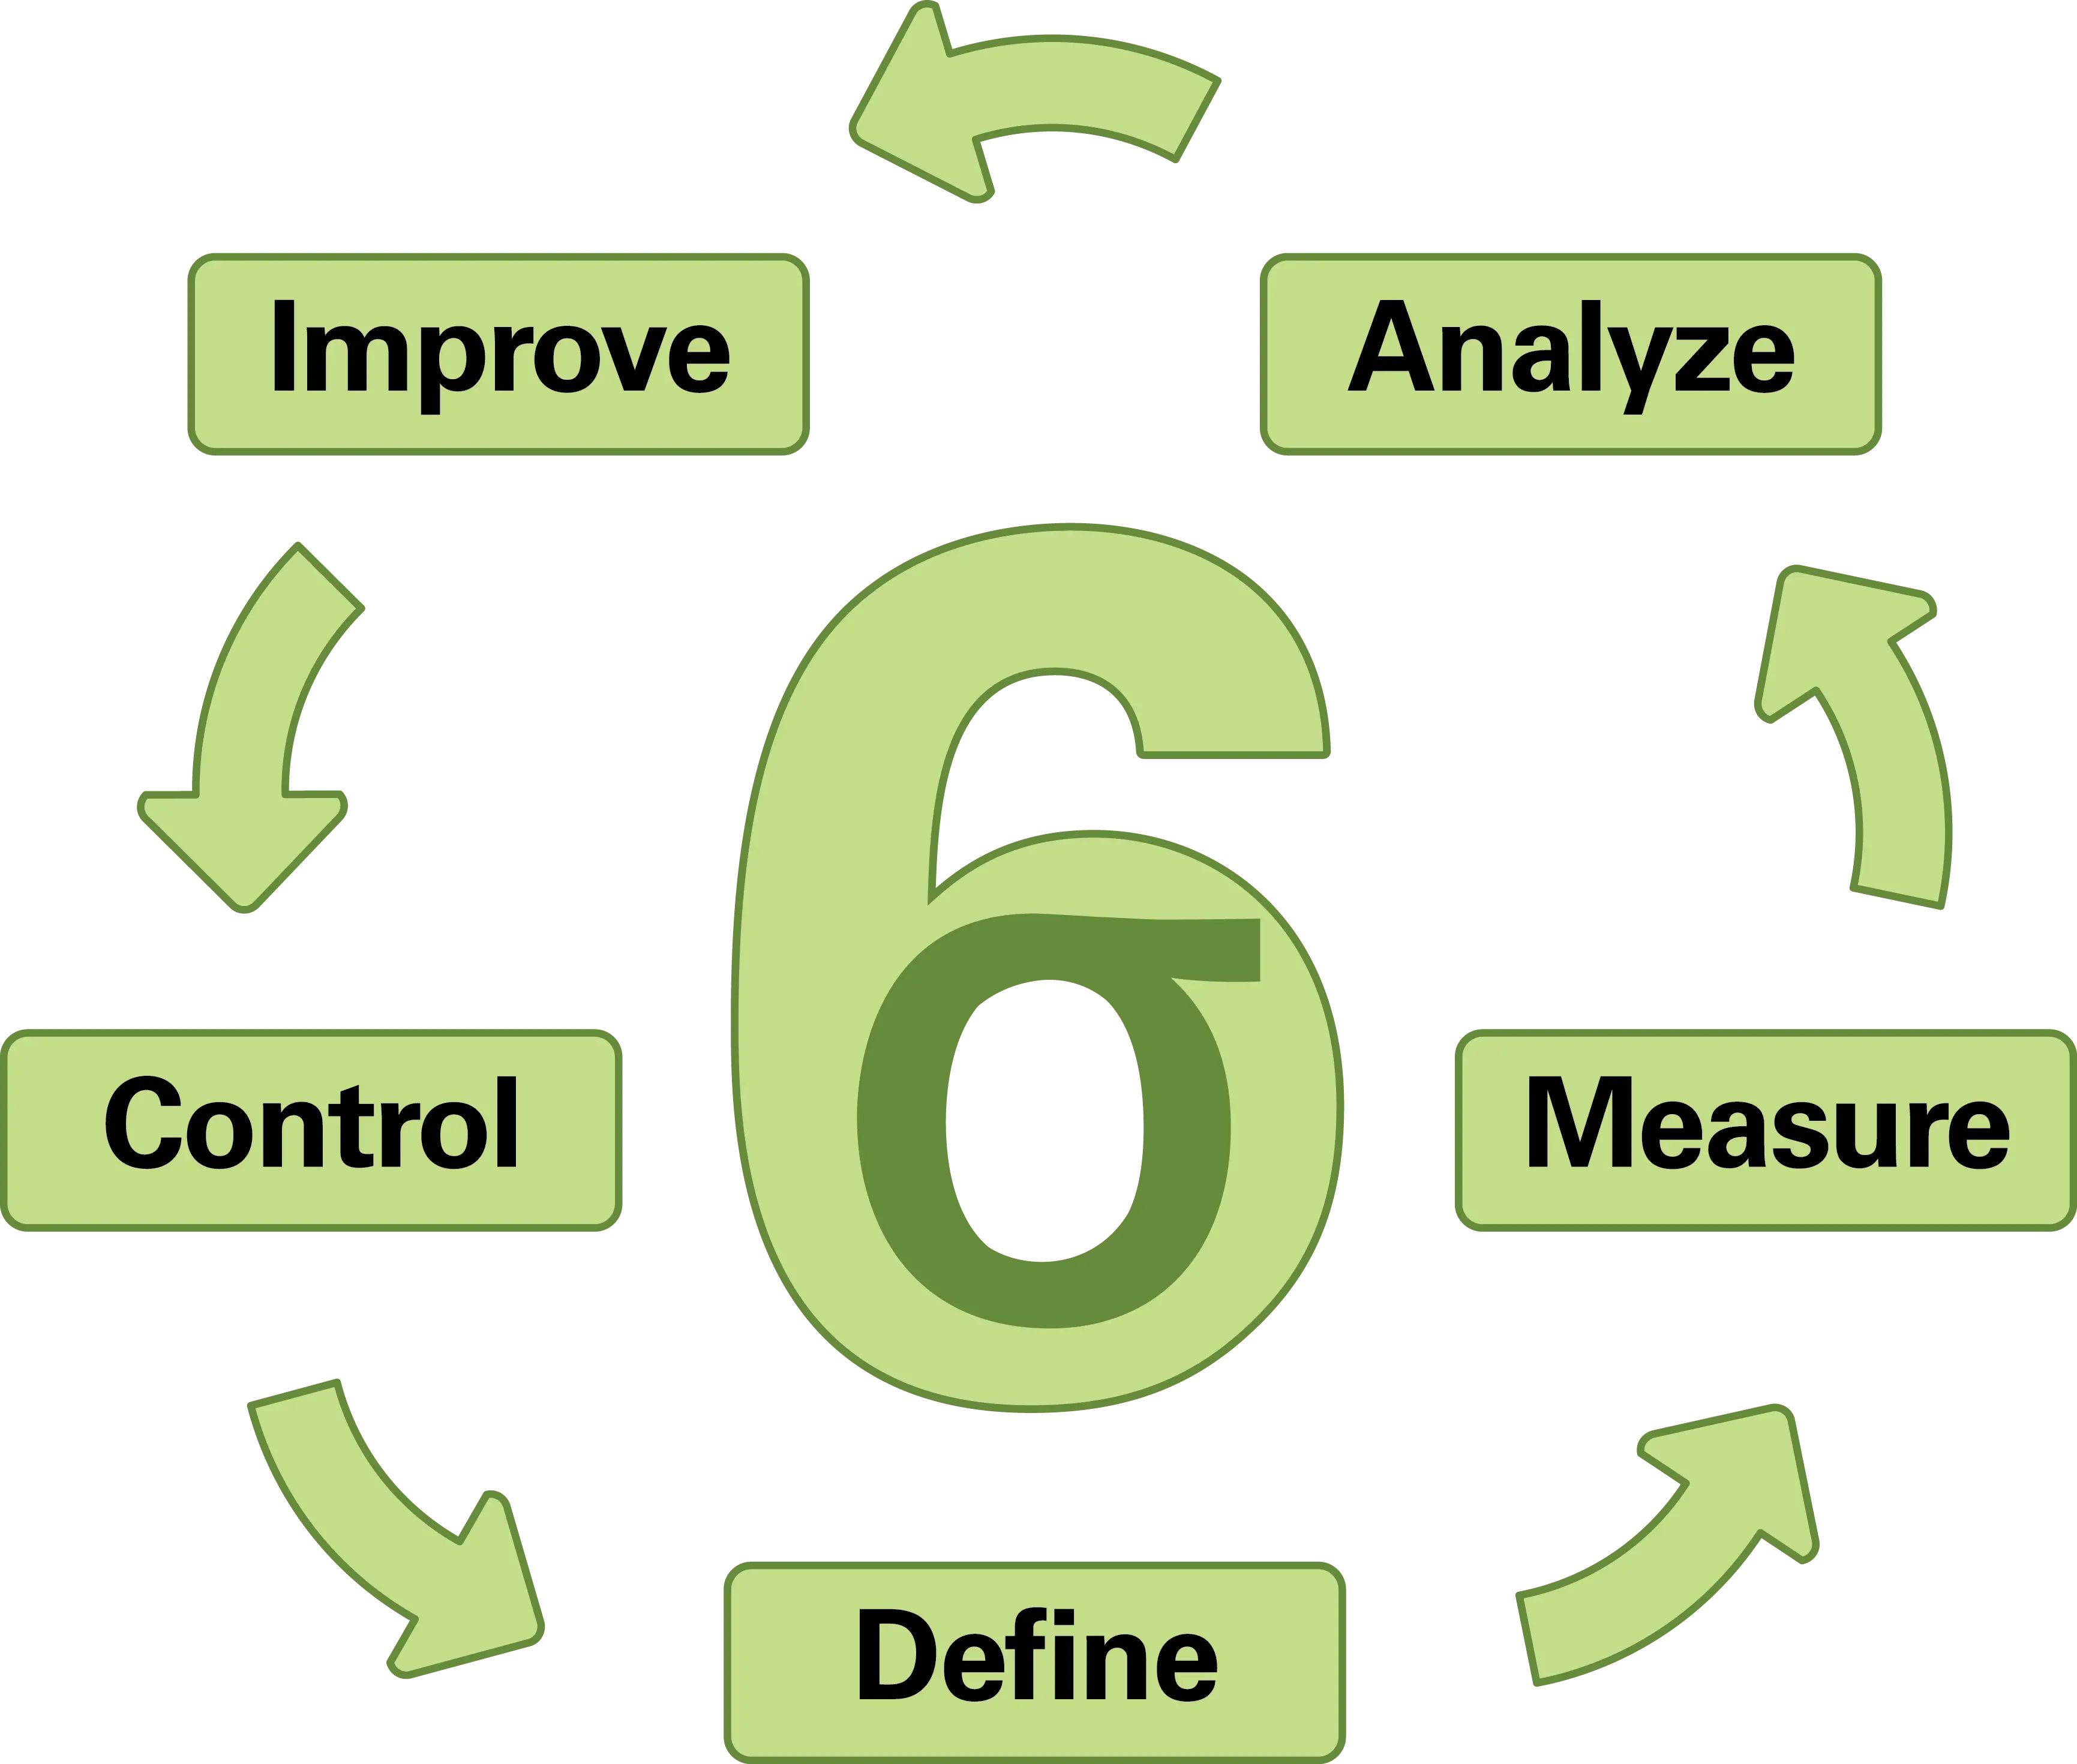
Continuous Improvement Cycle Diagram -

Red Bicycle Illustration -

Calendar with Deadline Marked -

Hand Truck with Boxes and Checklist for Logistics -

Green Flowchart Diagram -

Organized Toolbox for Maintenance -

Clipboard with Checklist for Task Organization -

Circular Arrow Reset Symbol -

Green and Blue Circular Arrows -

Open Leather Briefcase