You Might Like
-
Mathematical Geometry and Graph Concepts -

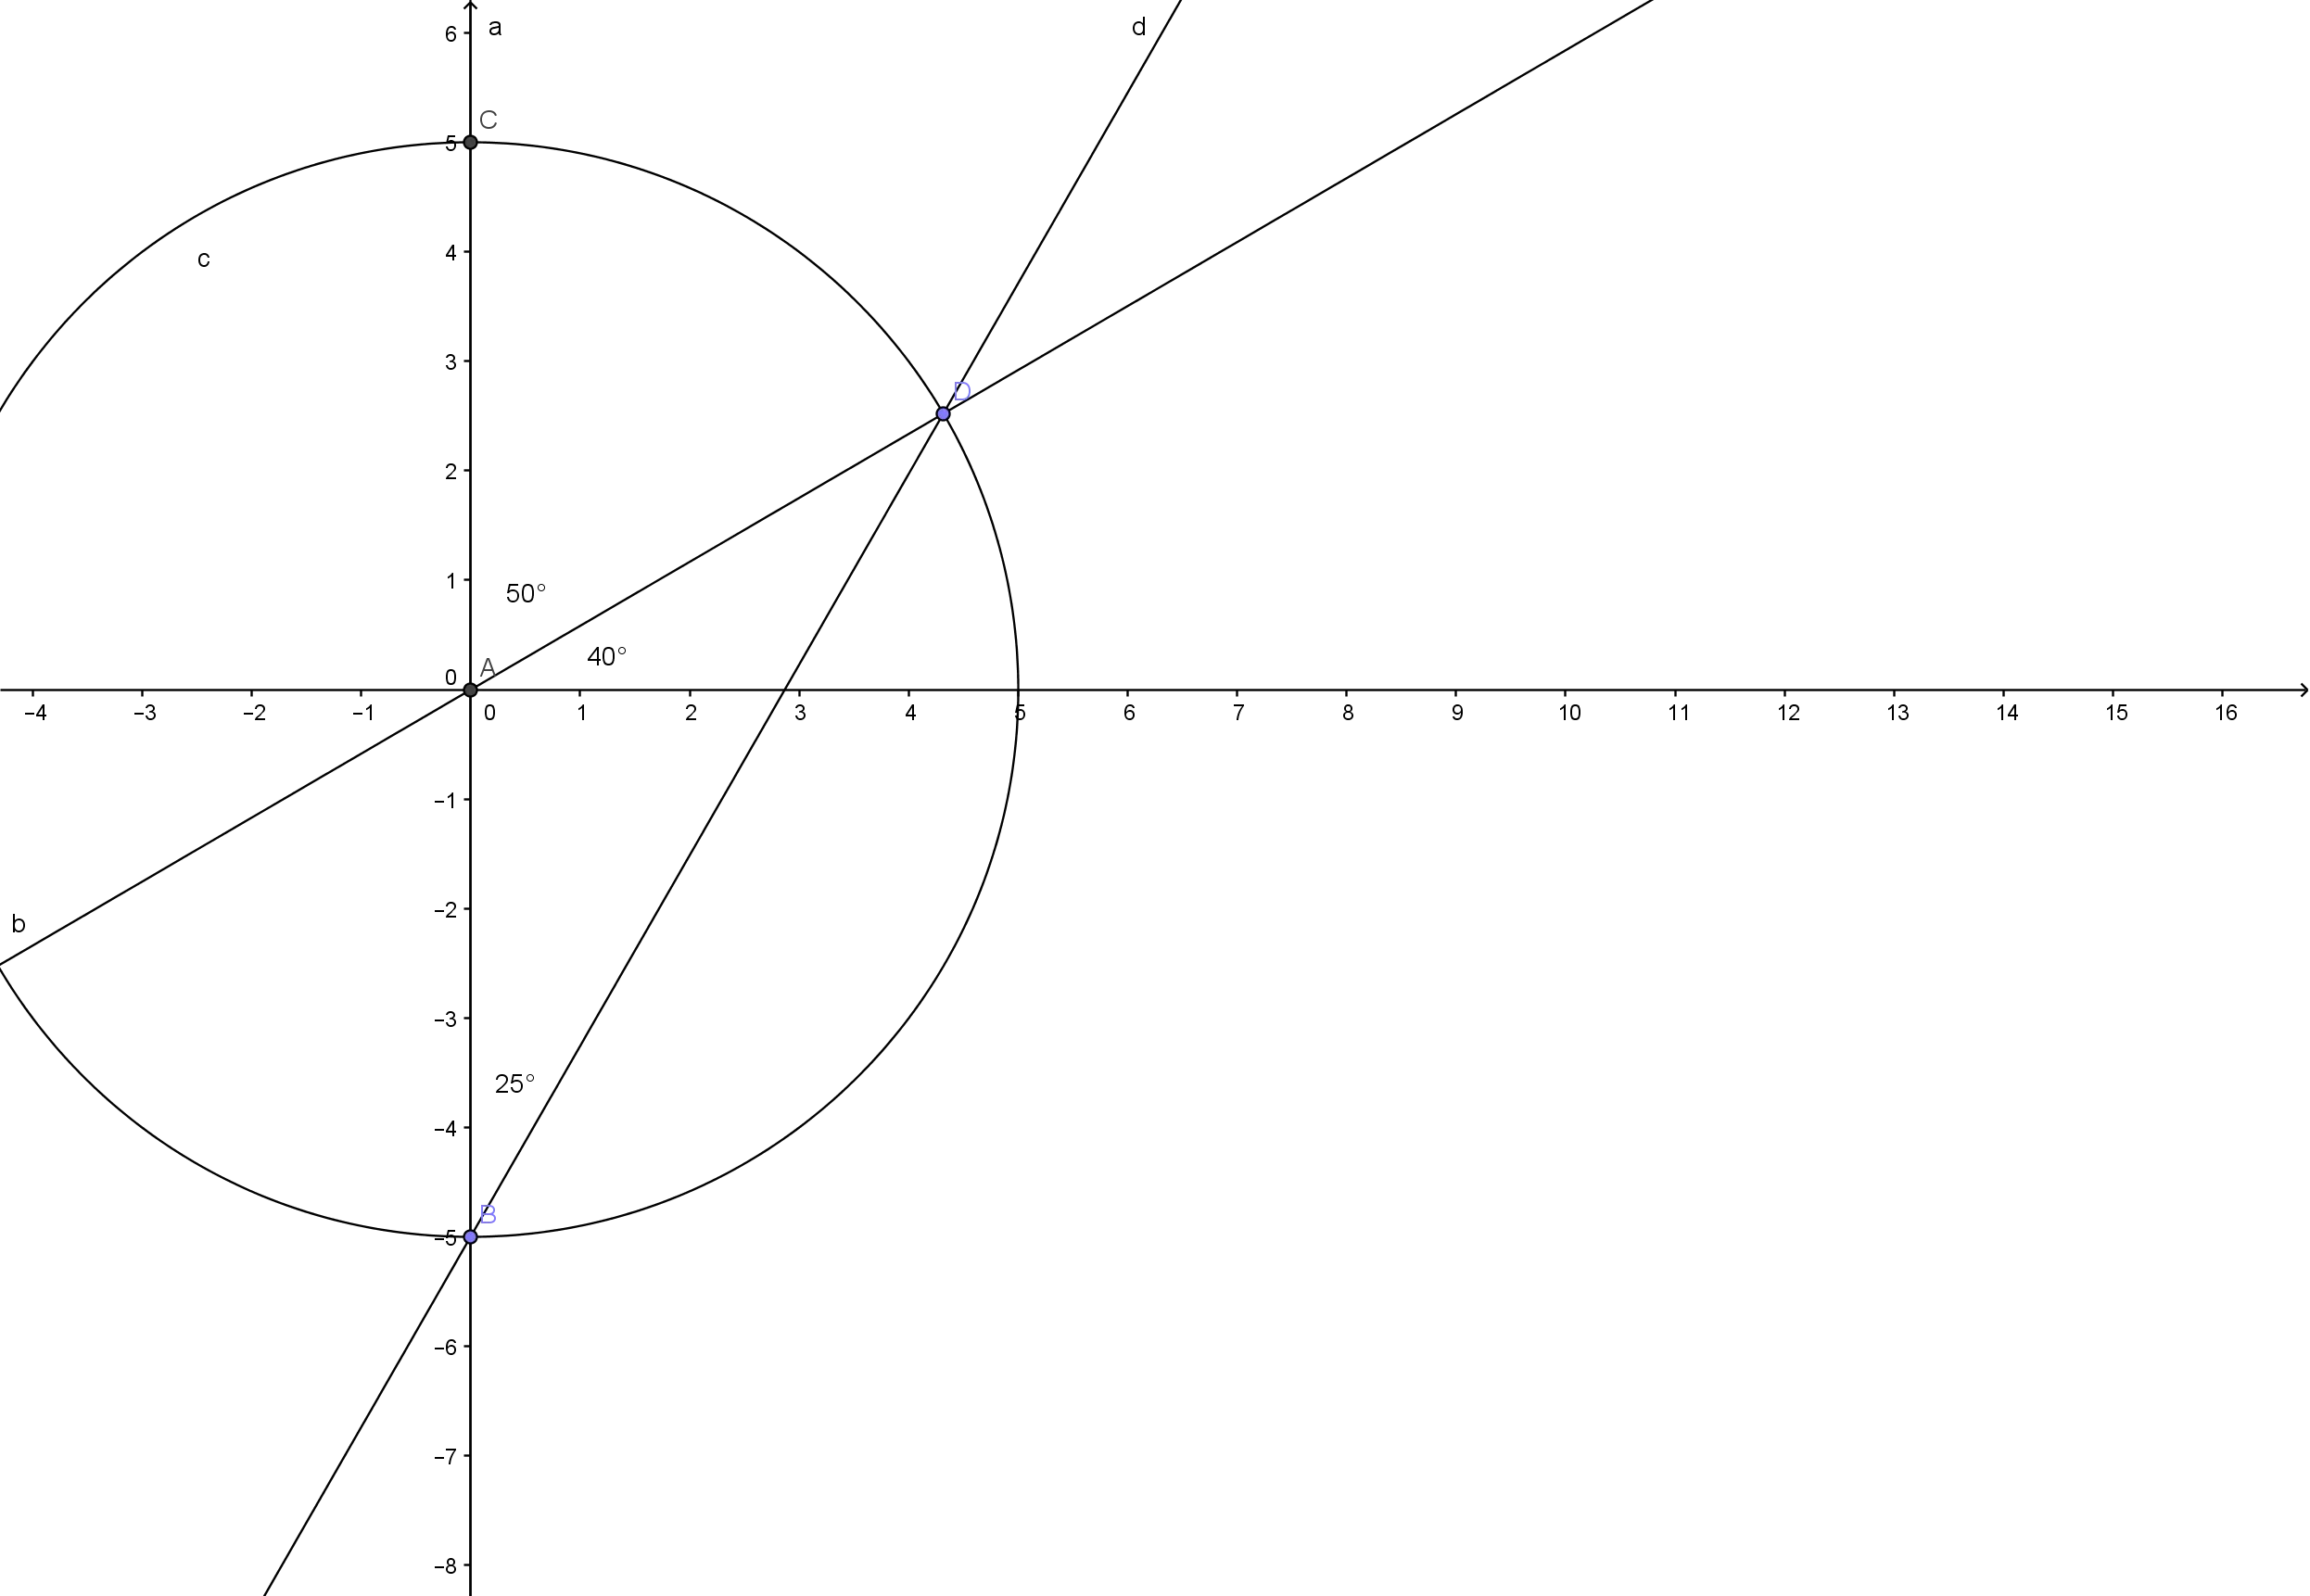
Graph Plot with Blue Curve Illustration -

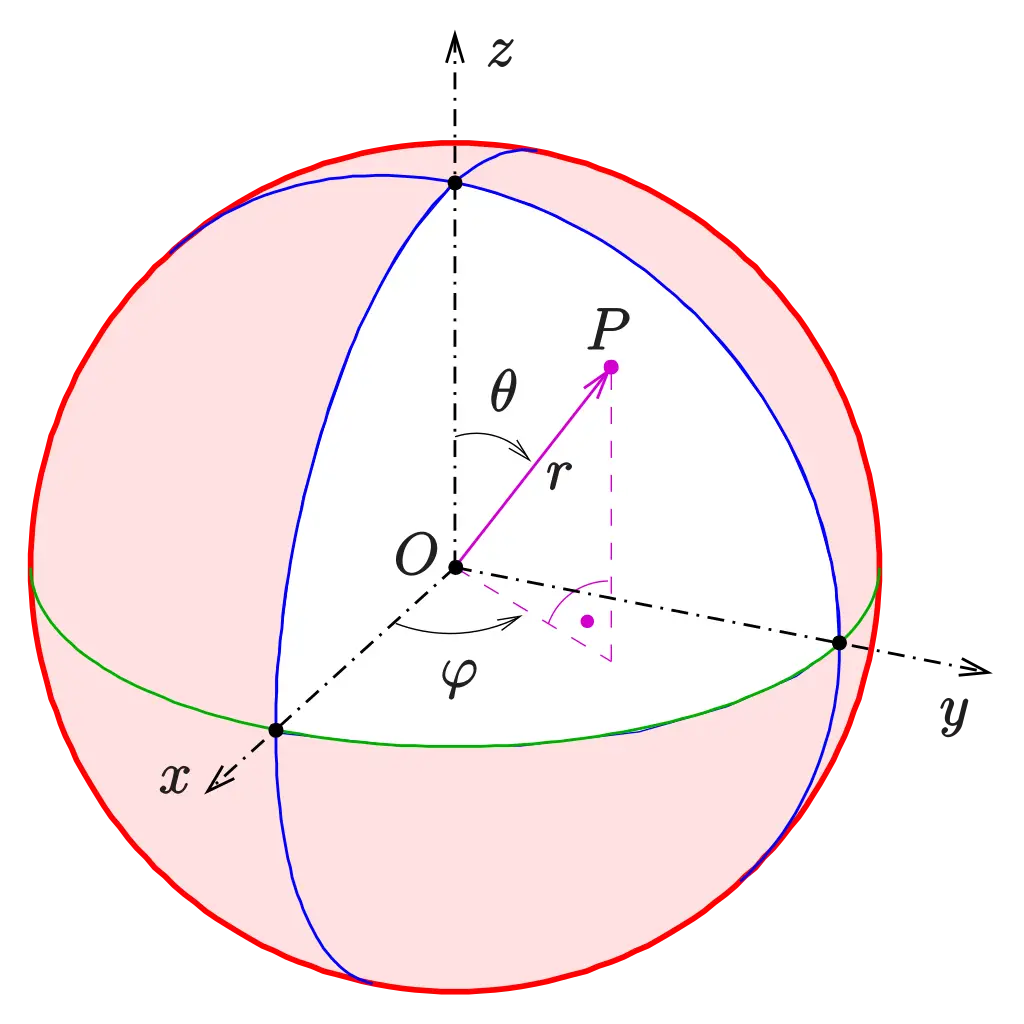
3D Coordinate System Illustration -

Mathematical Formula Equation -

Traditional Abacus for Calculation and Learning -
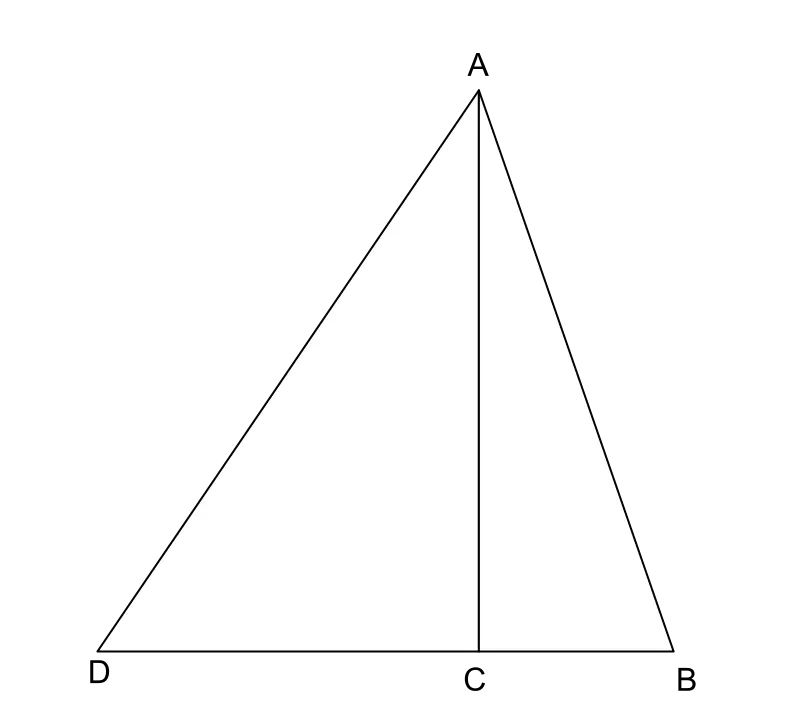
Triangle Diagram for Geometric Representation -
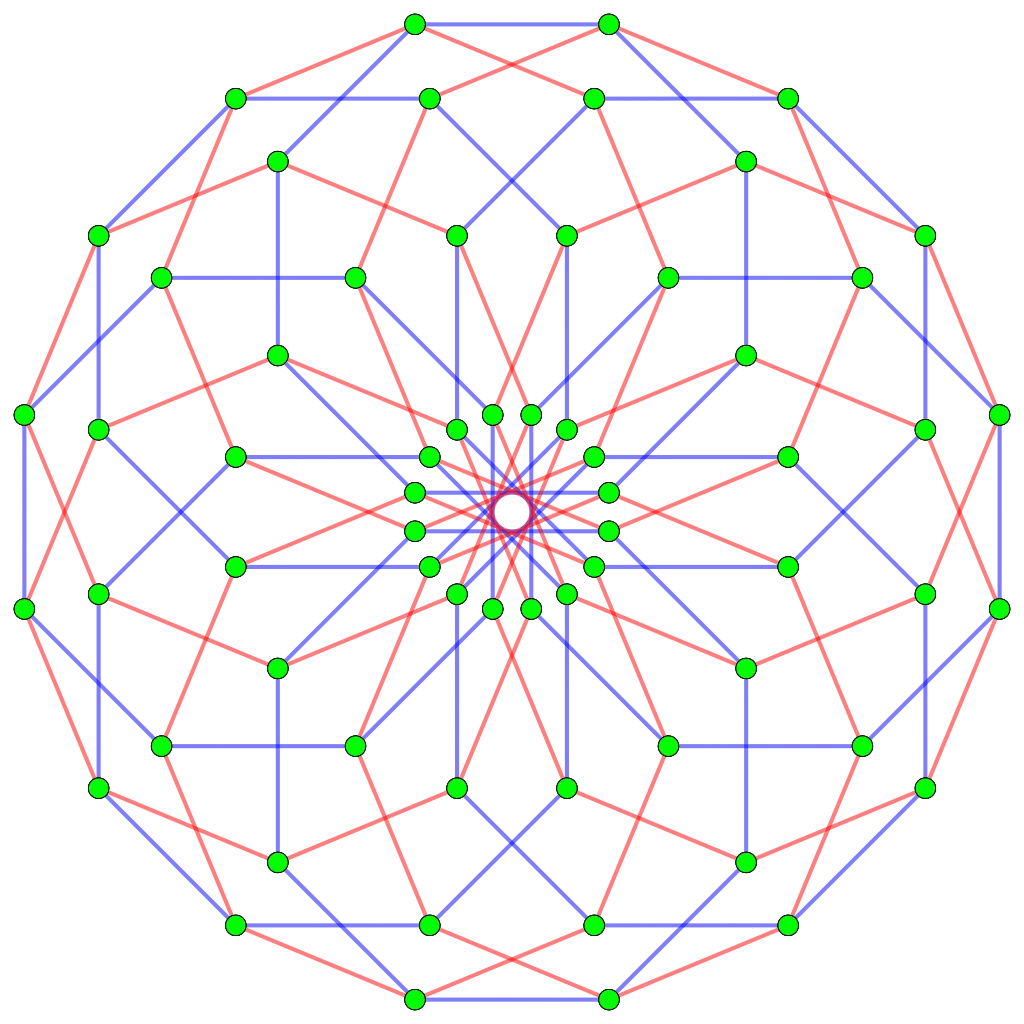
Mathematical Network Diagram with Nodes and Lines -
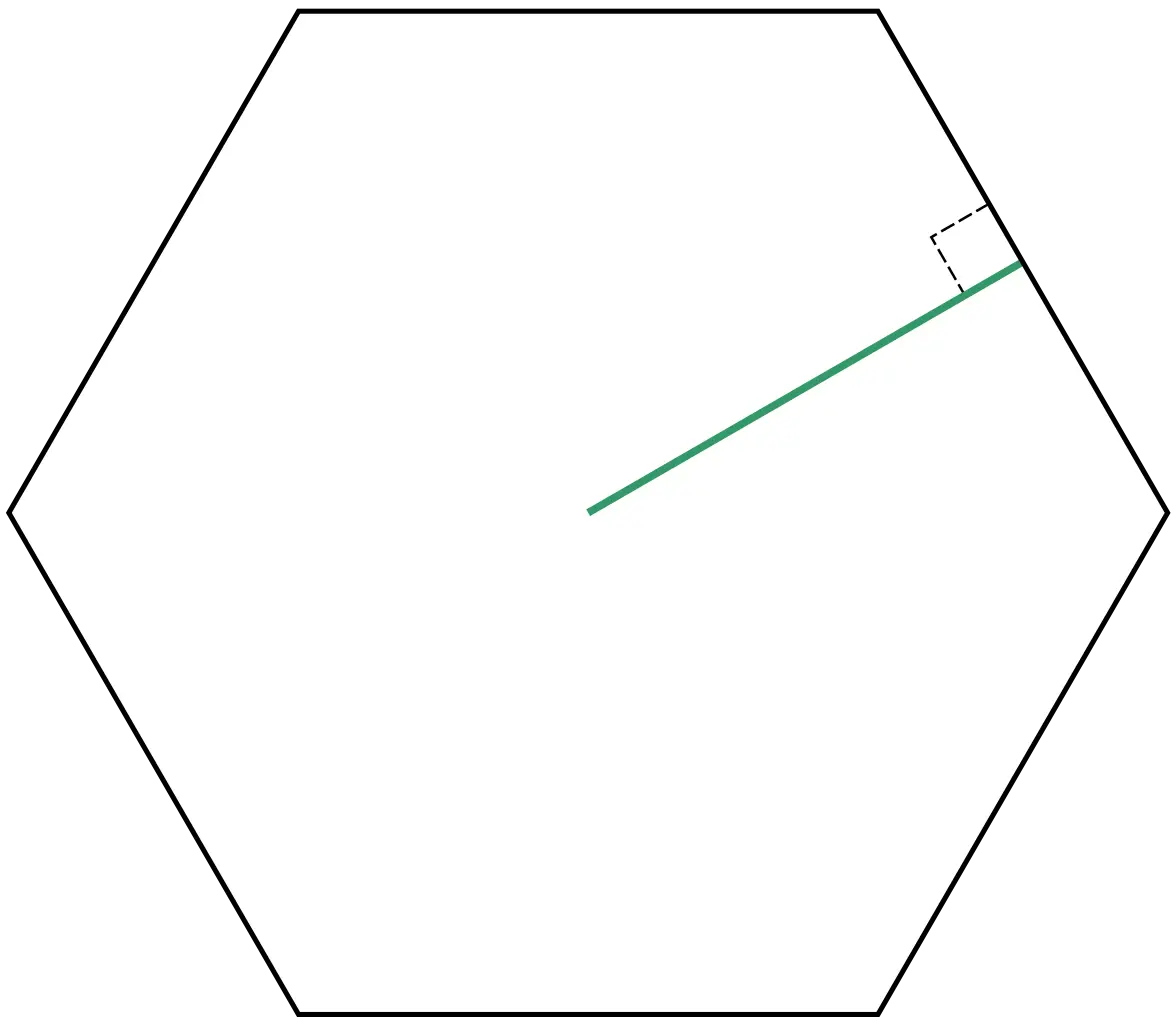
Hexagon Shape -
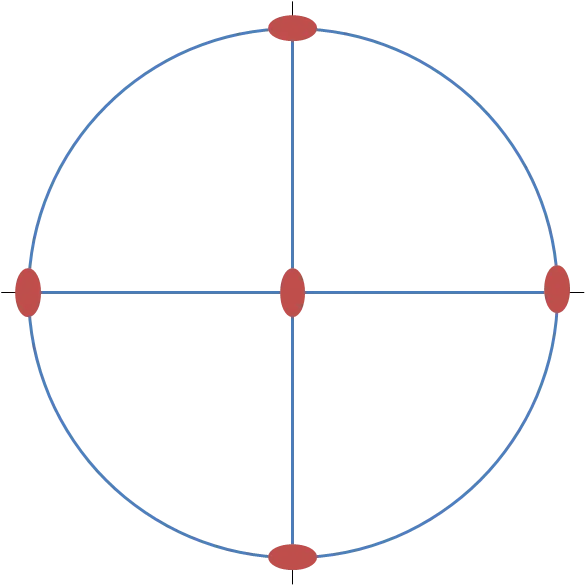
Geometric Circle with Points -

Mathematical Symbol for Equations -
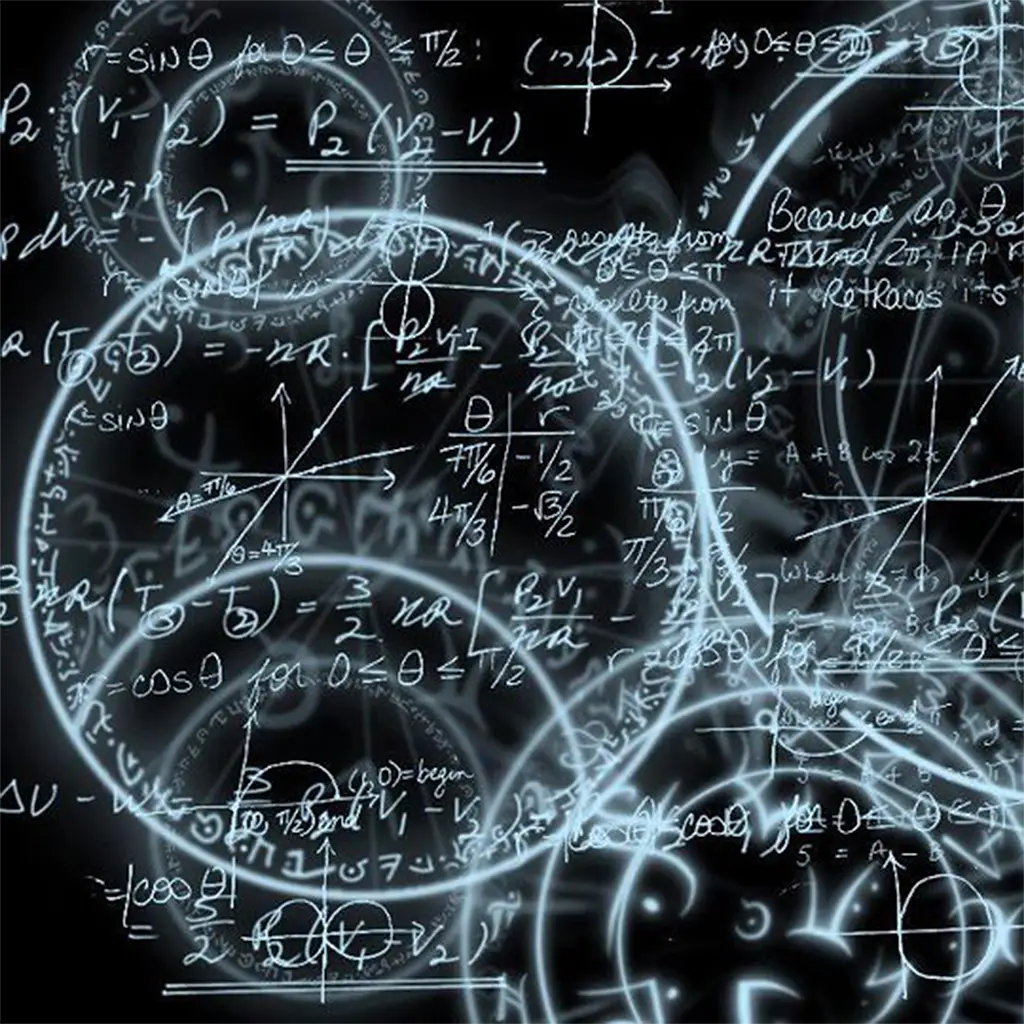
Complex Mathematical Equations -
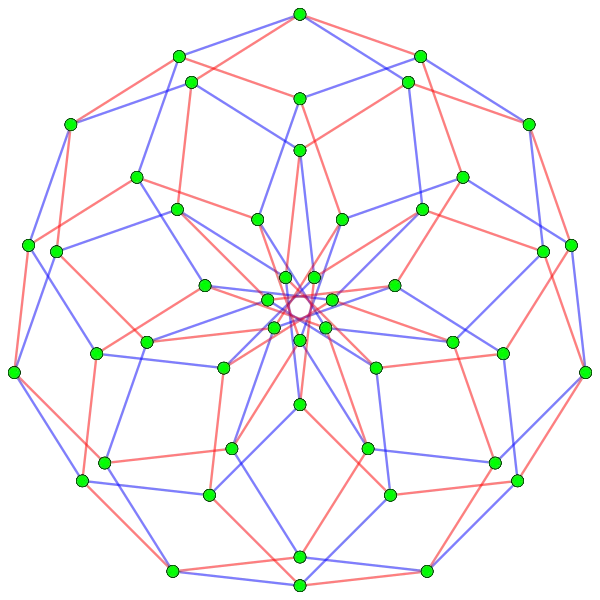
Geometric Node and Edge Structure Illustration -
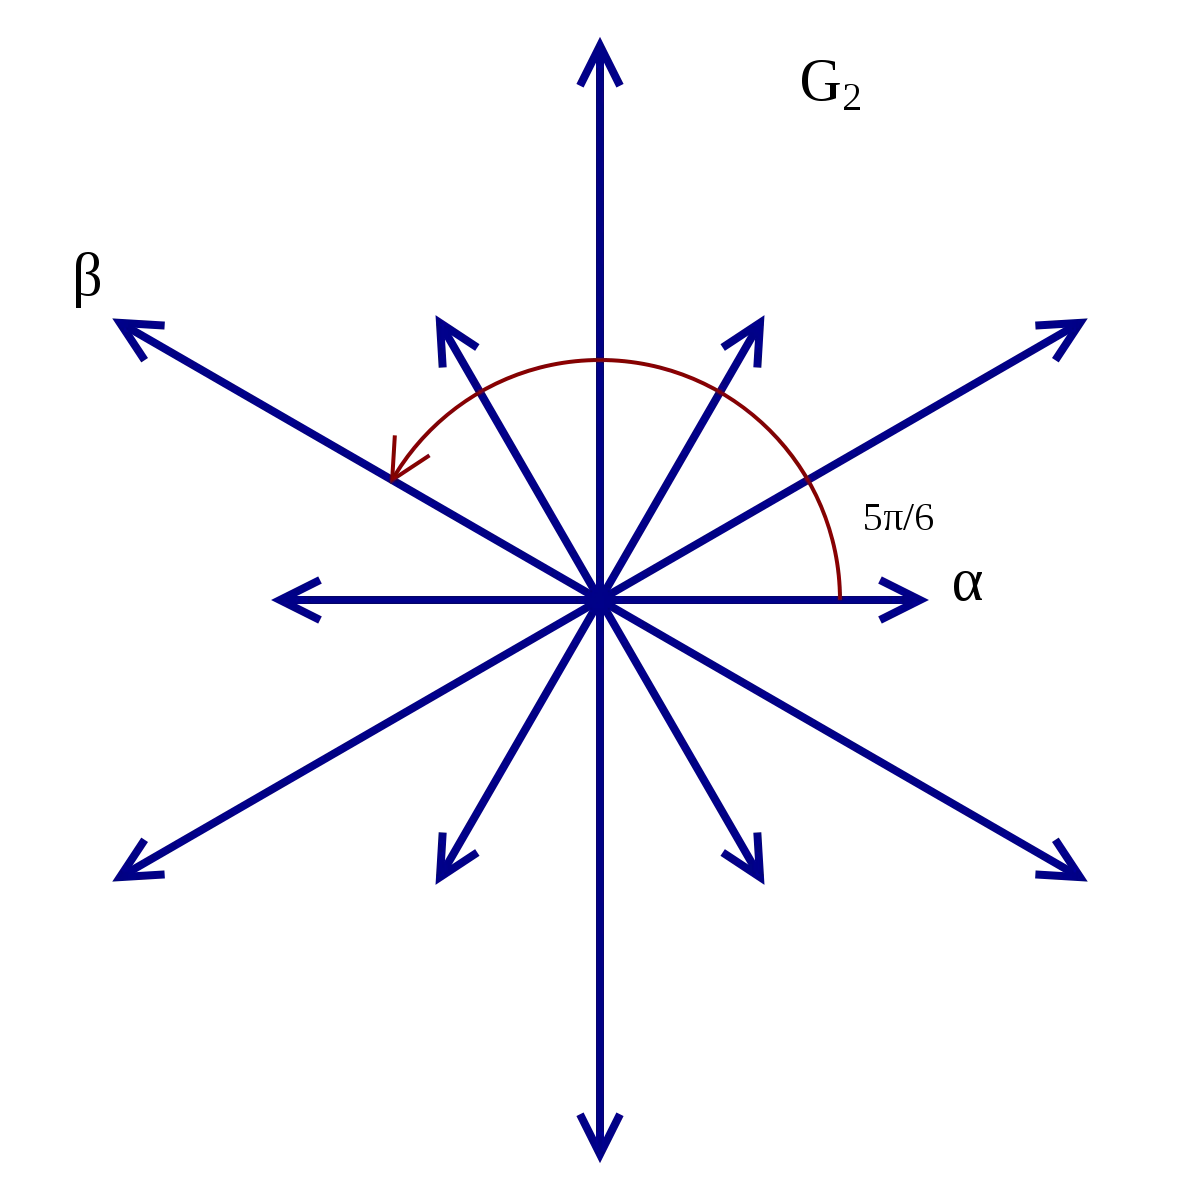
Complex Mathematical Diagram with Arrows -
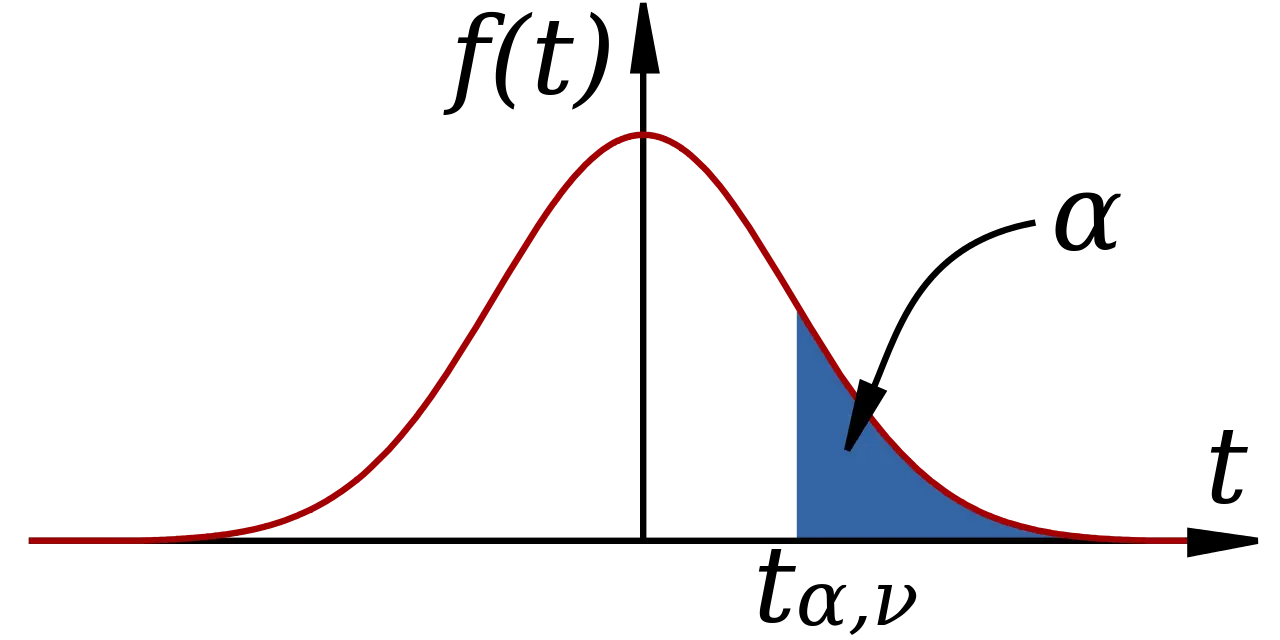
Mathematical Function Graph with Highlighted Area -

Equal Sign Symbol -

Red Percentage Symbol -
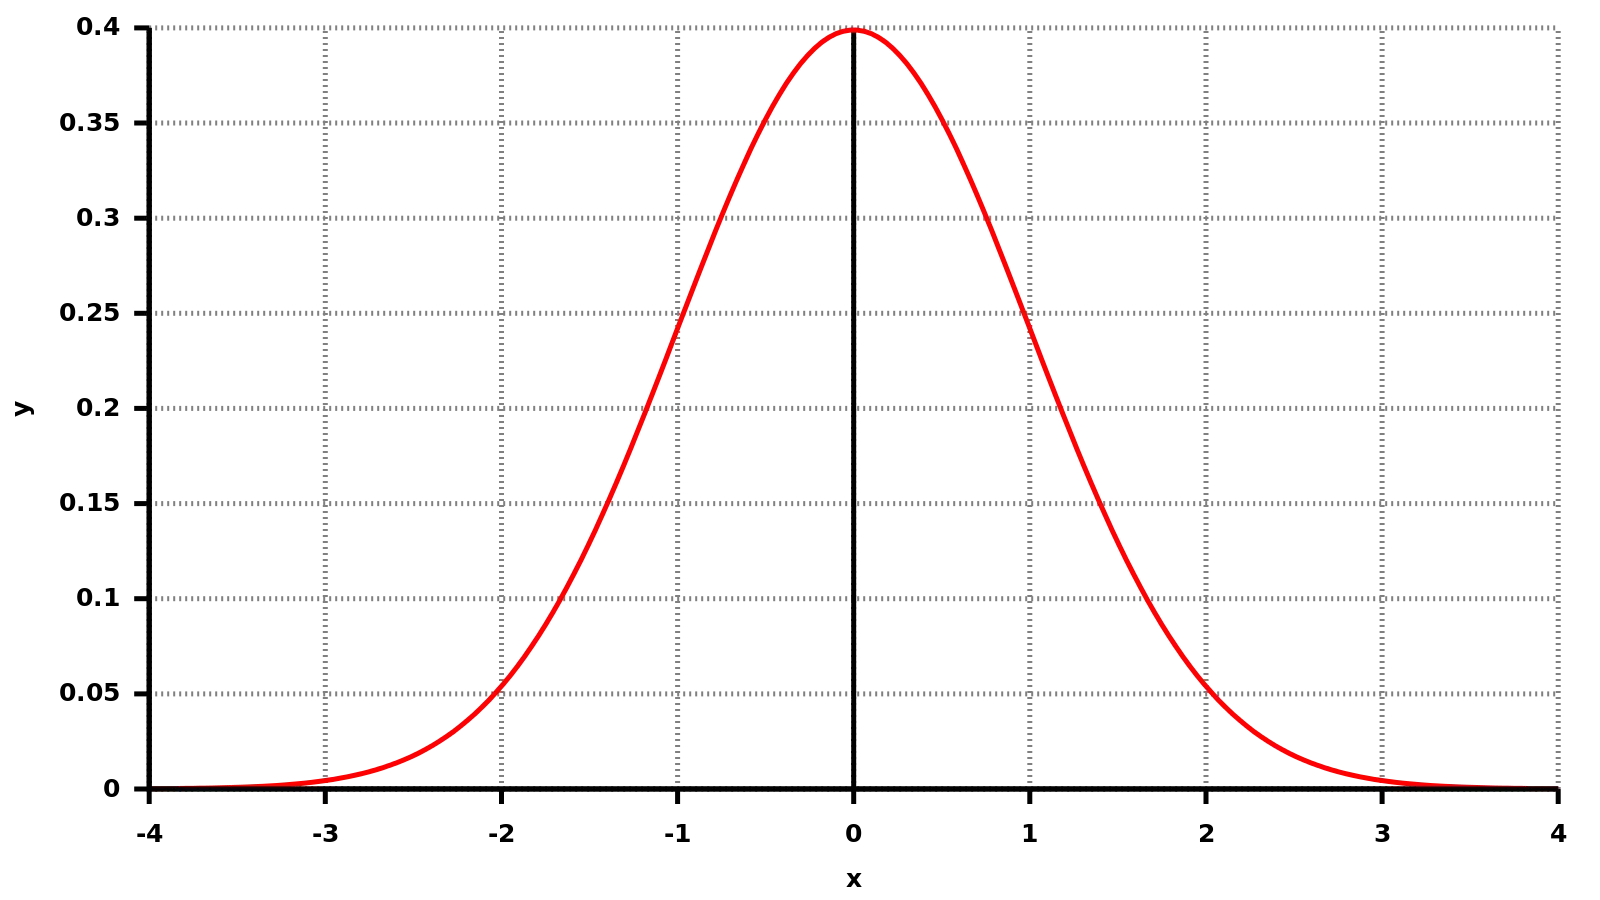
Bell Curve Graph for Statistics -
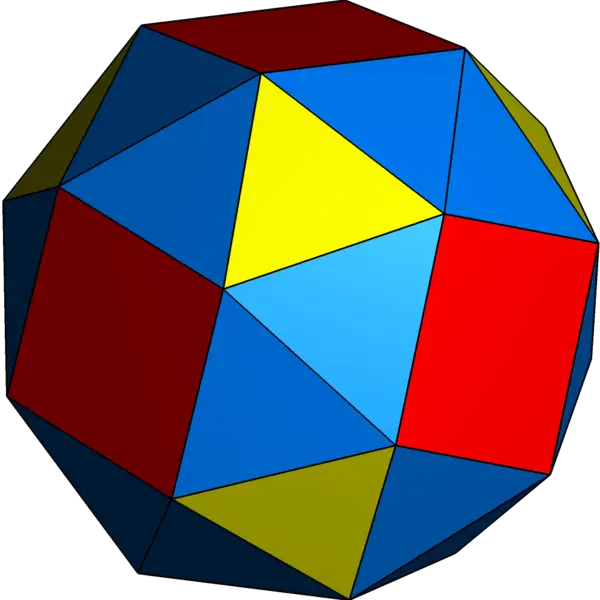
Colorful Geometric Polyhedron -

Mathematical Symbol X Squared -
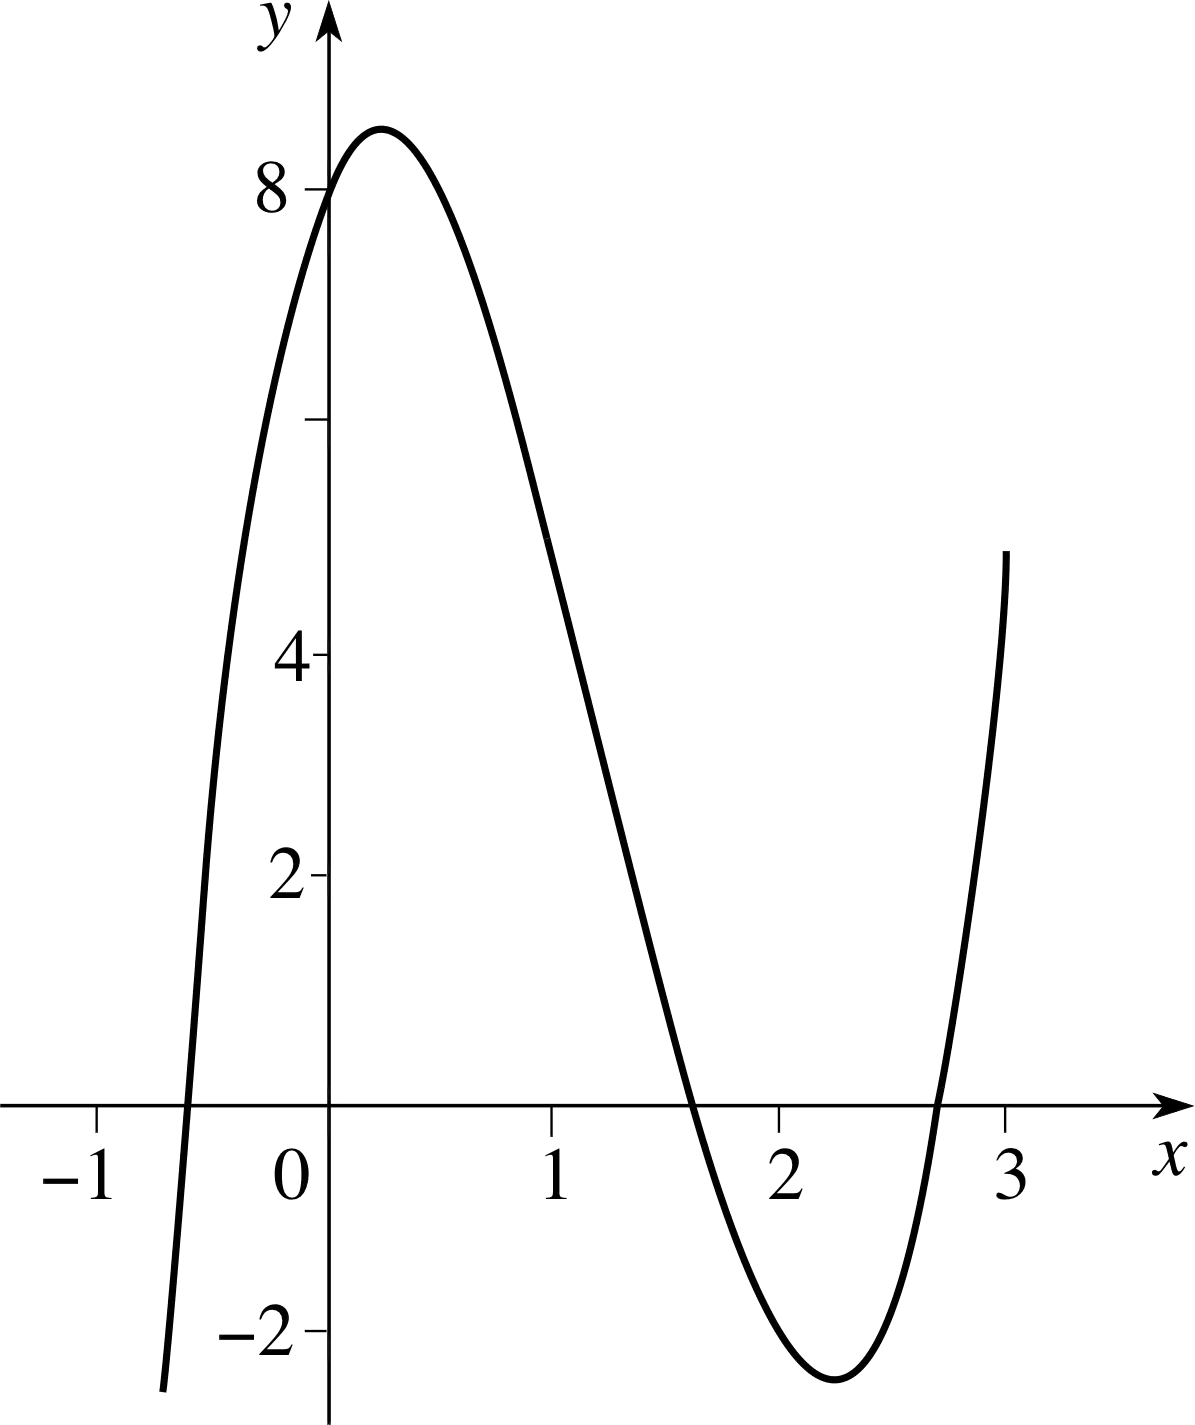
Mathematical Graph Curve on Coordinate Axes -

Greek Letter Rho Symbol for Mathematical Notation -
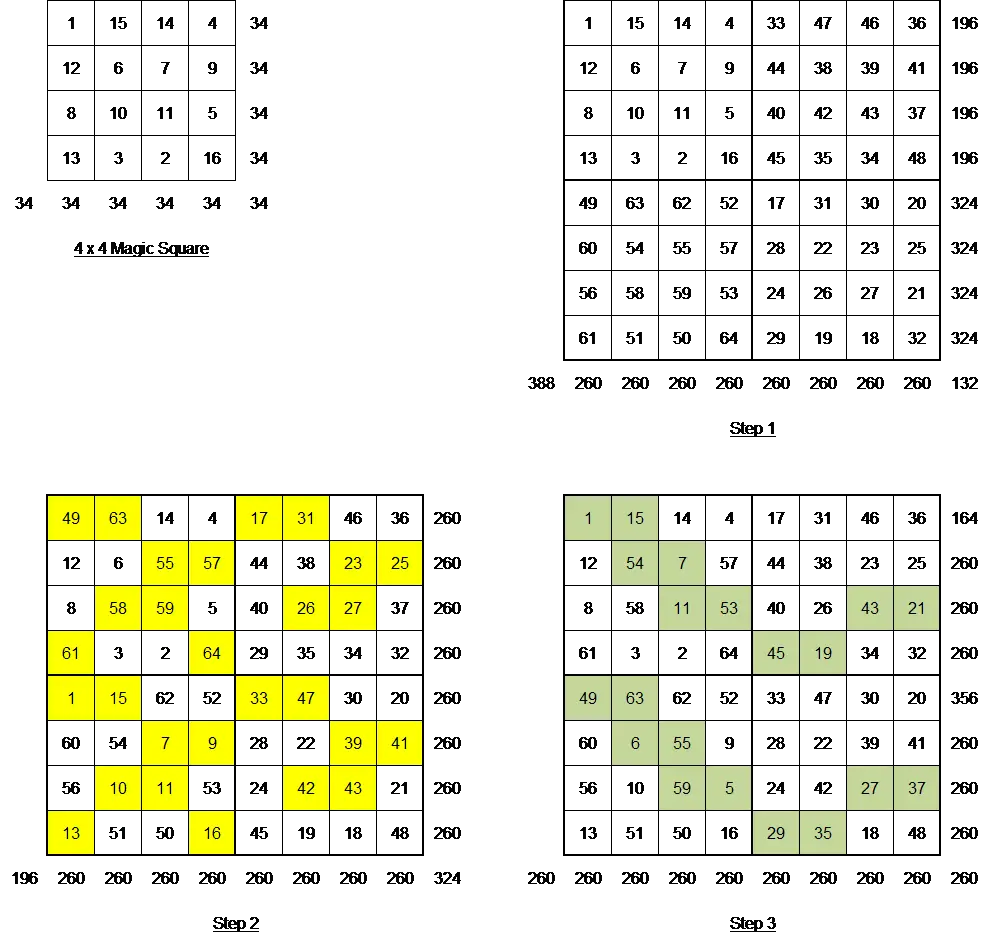
Magic Square Number Puzzle -
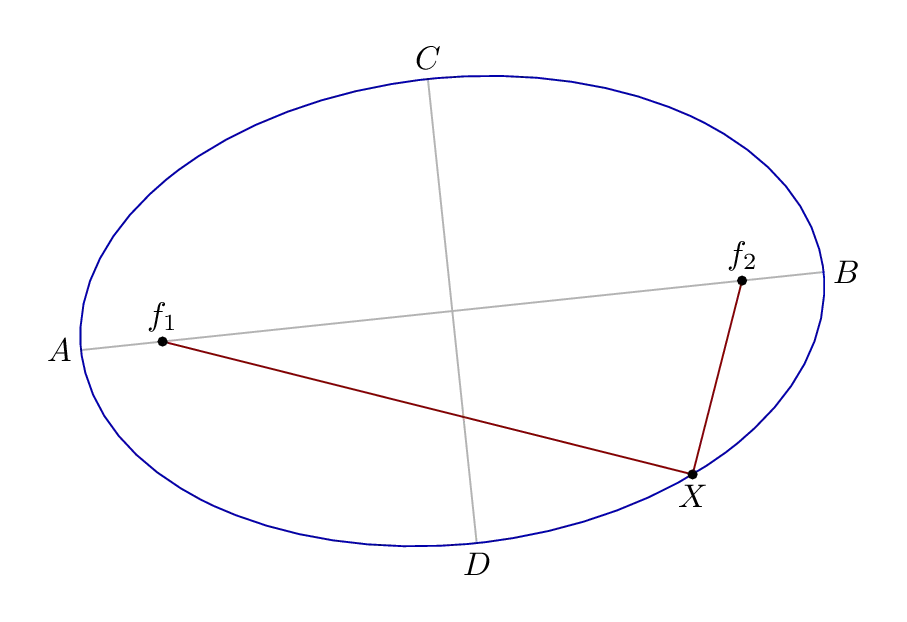
Mathematical Diagram of an Ellipse -

Blue ASCII Curly Bracket Graphic -

Delta and Delta Symbol in Bold -

Greek Mu Symbol -
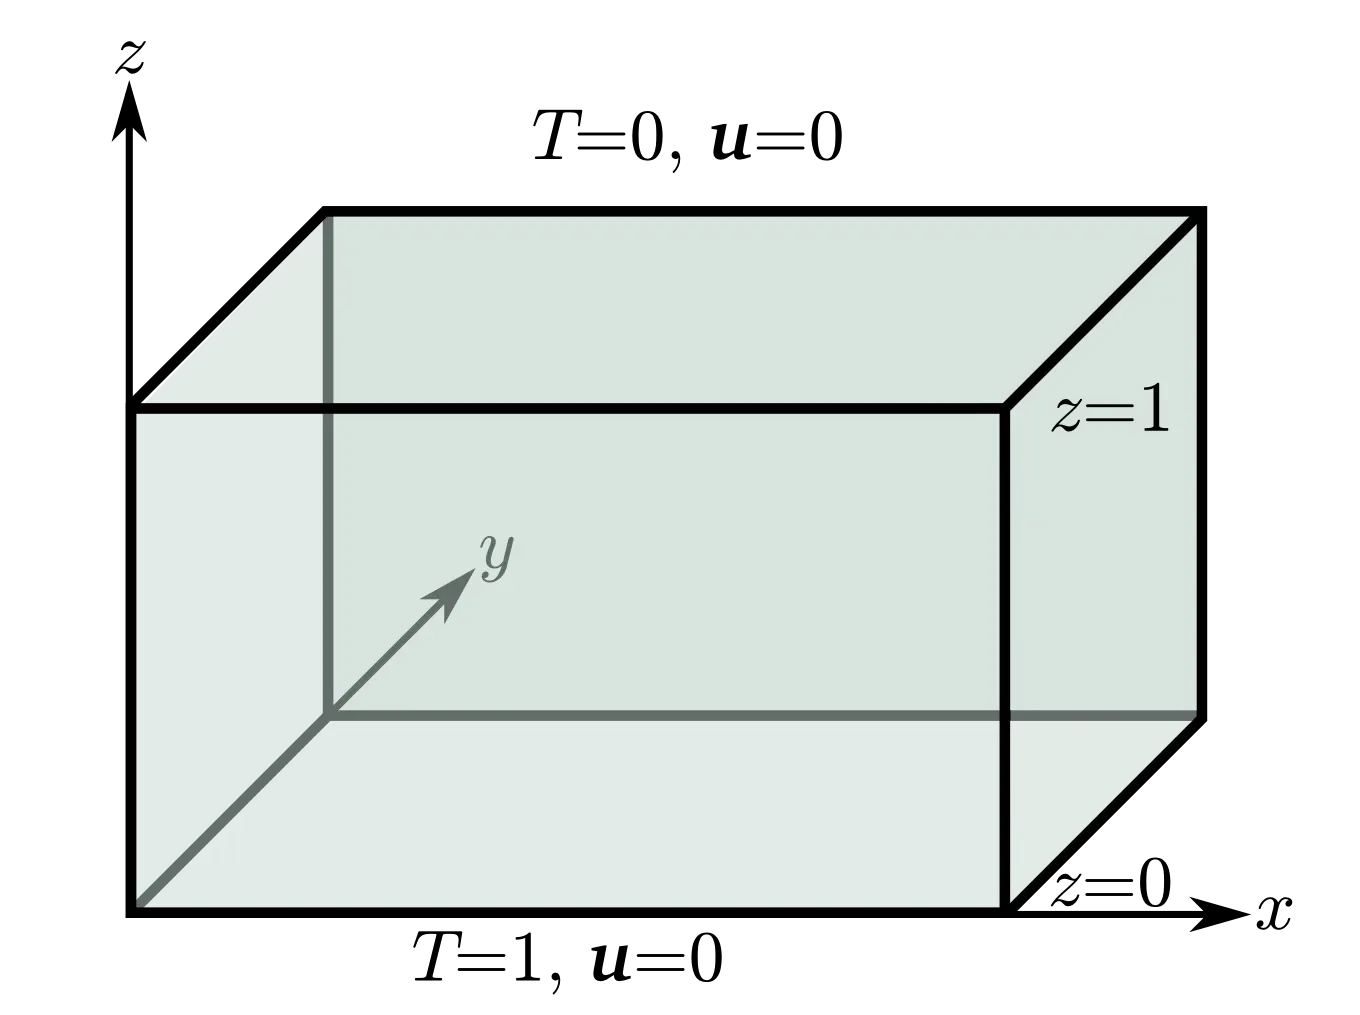
3D Box Diagram with Coordinates -
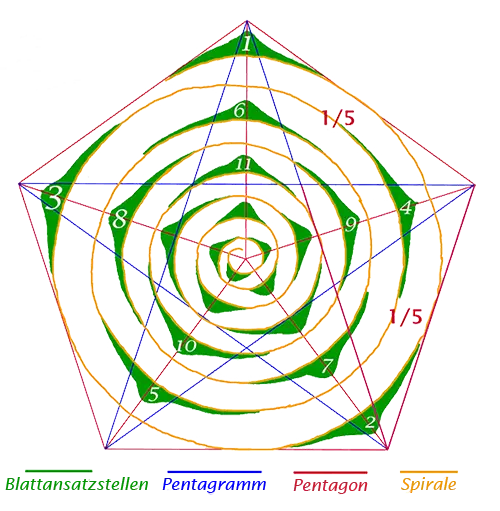
Pentagon Spiral Diagram -

Mathematical Lambda Symbol -

Golden Ratio Spiral Illustration