You Might Like
-

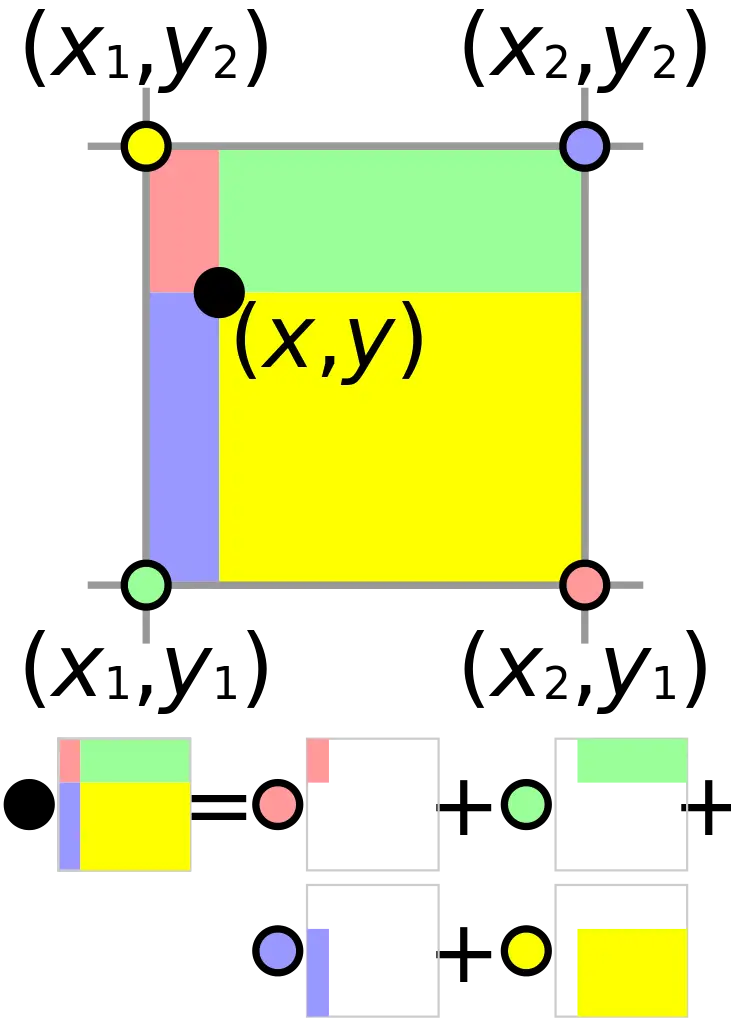
Mathematical Geometry and Graph Concepts -

3D Coordinate System Illustration -

Digestive System Diagram -
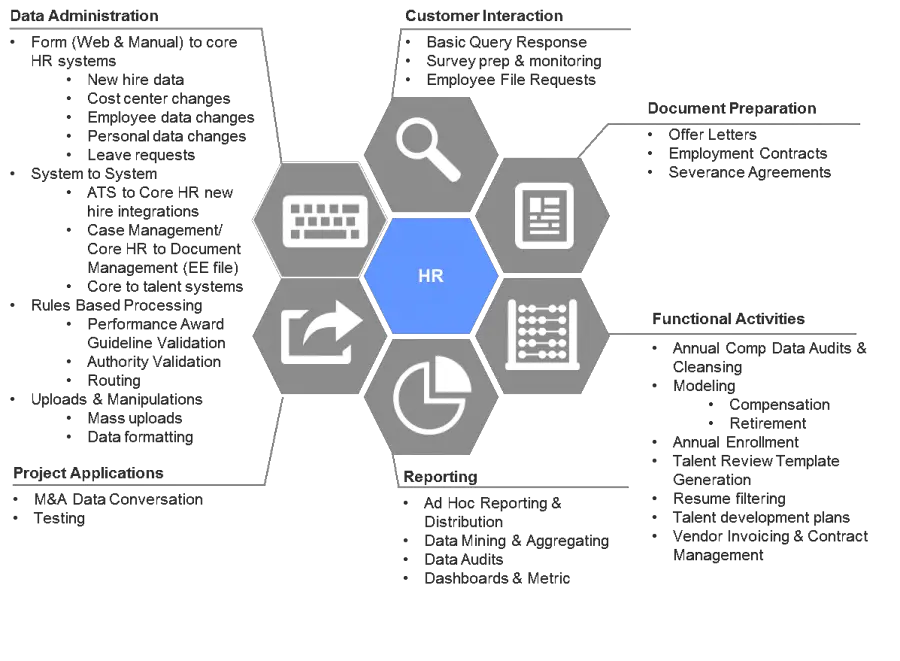
HR Workflow Diagram -

Detailed Lungs Diagram Illustration -
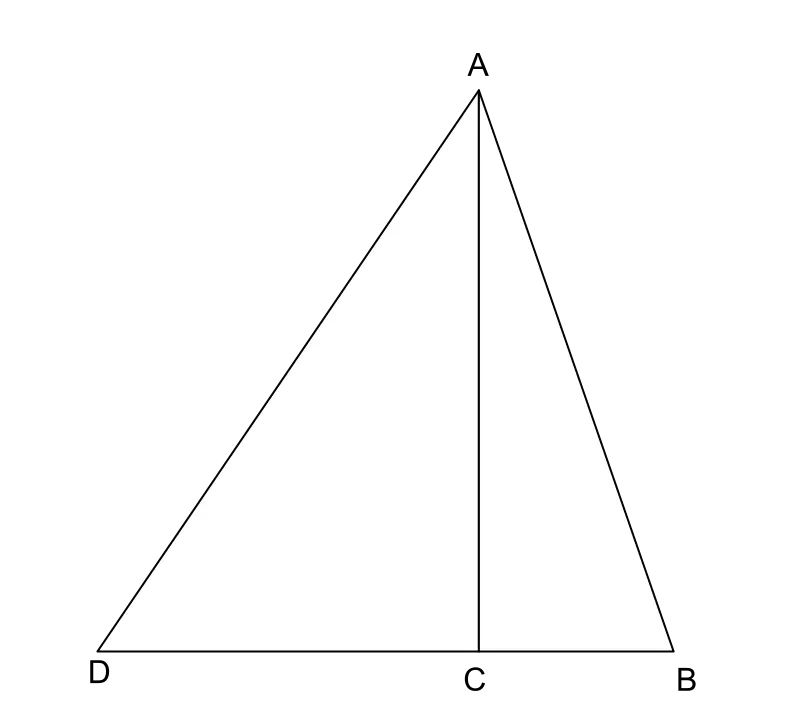
Triangle Diagram for Geometric Representation -
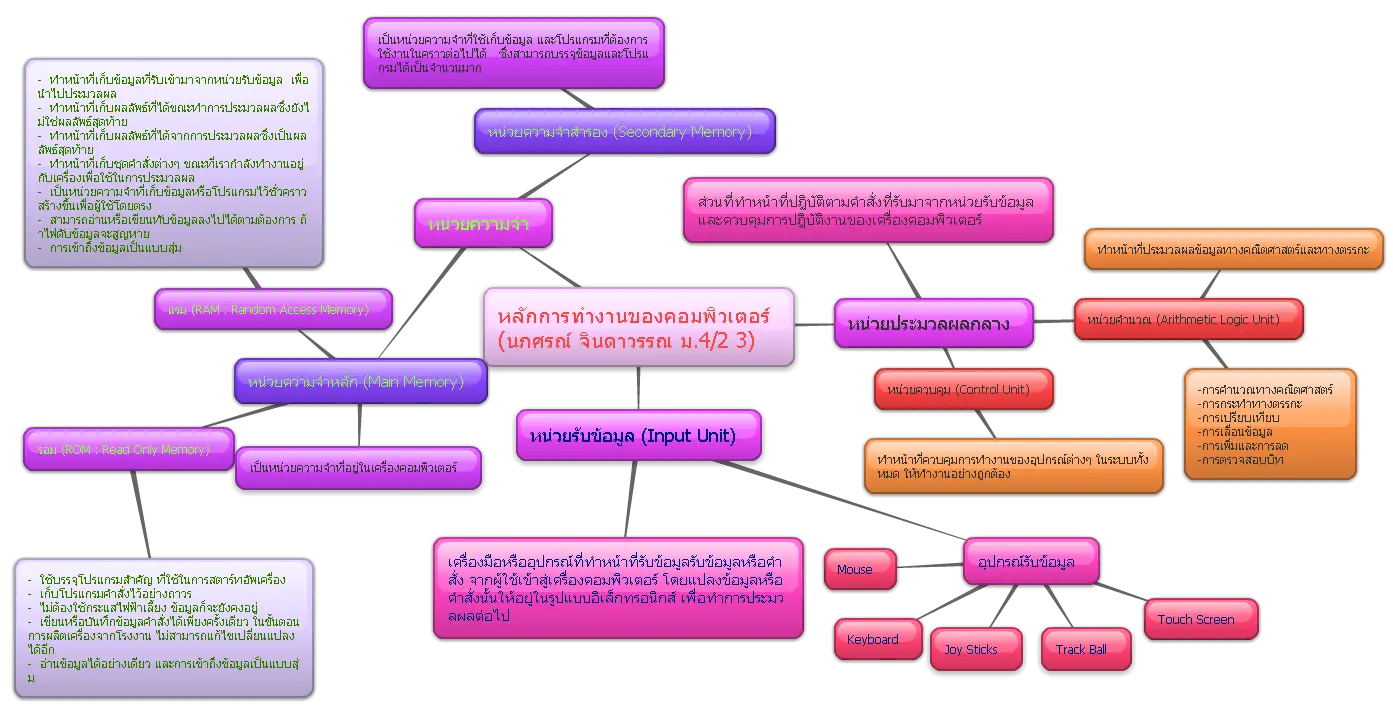
Mind Map Diagram in Colorful Design -
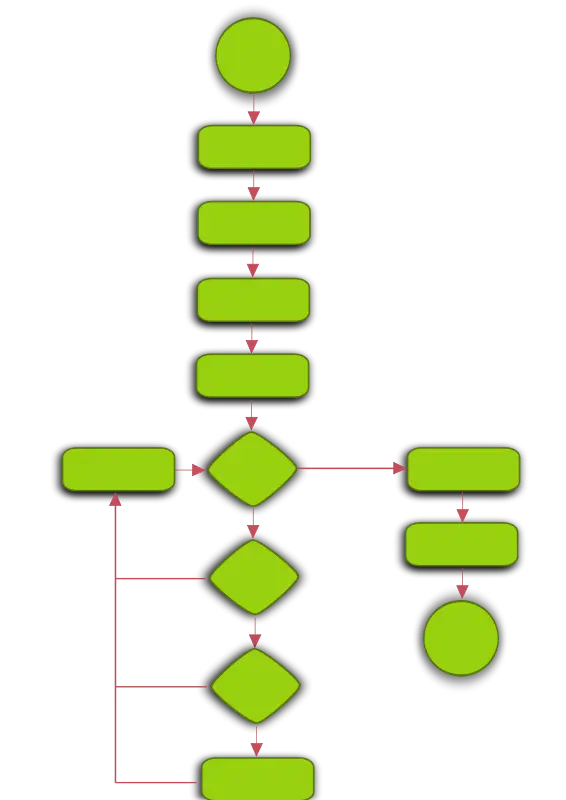
Green Flowchart Diagram -
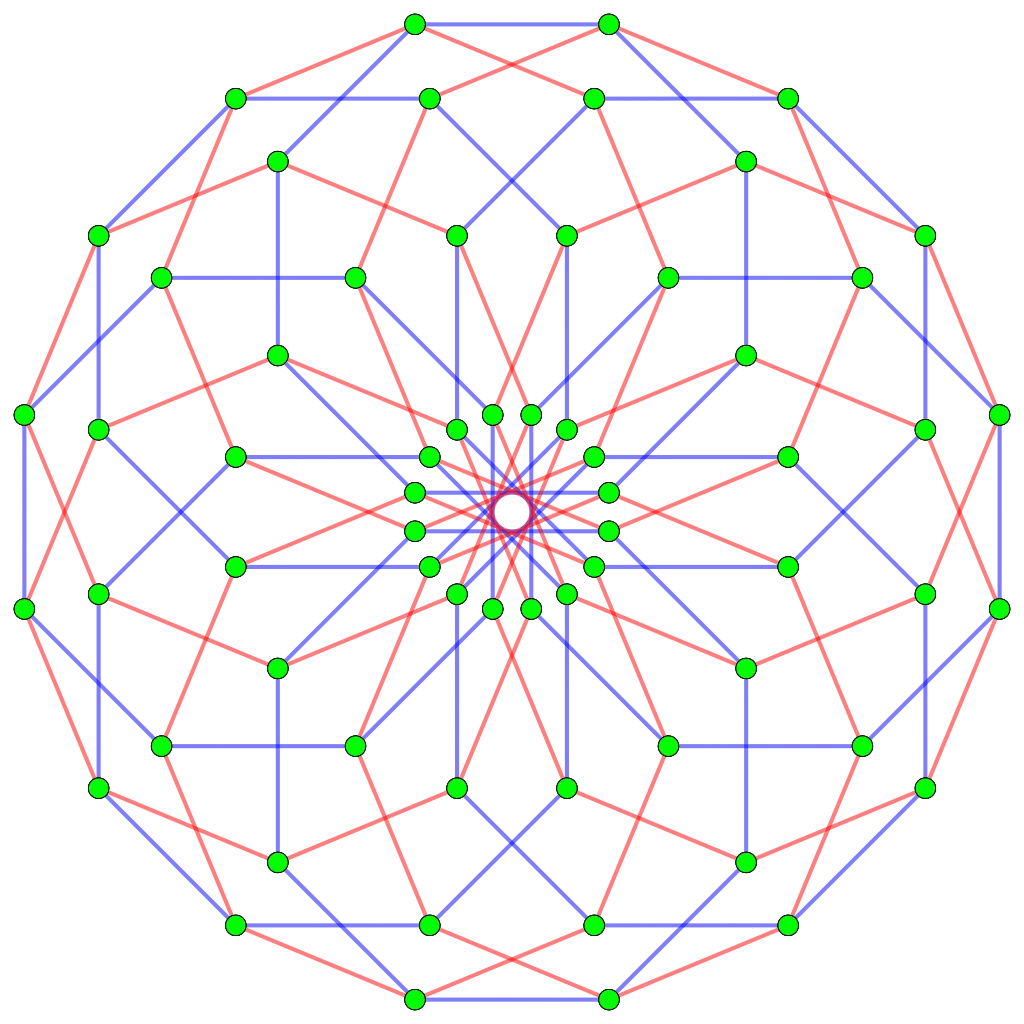
Mathematical Network Diagram with Nodes and Lines -
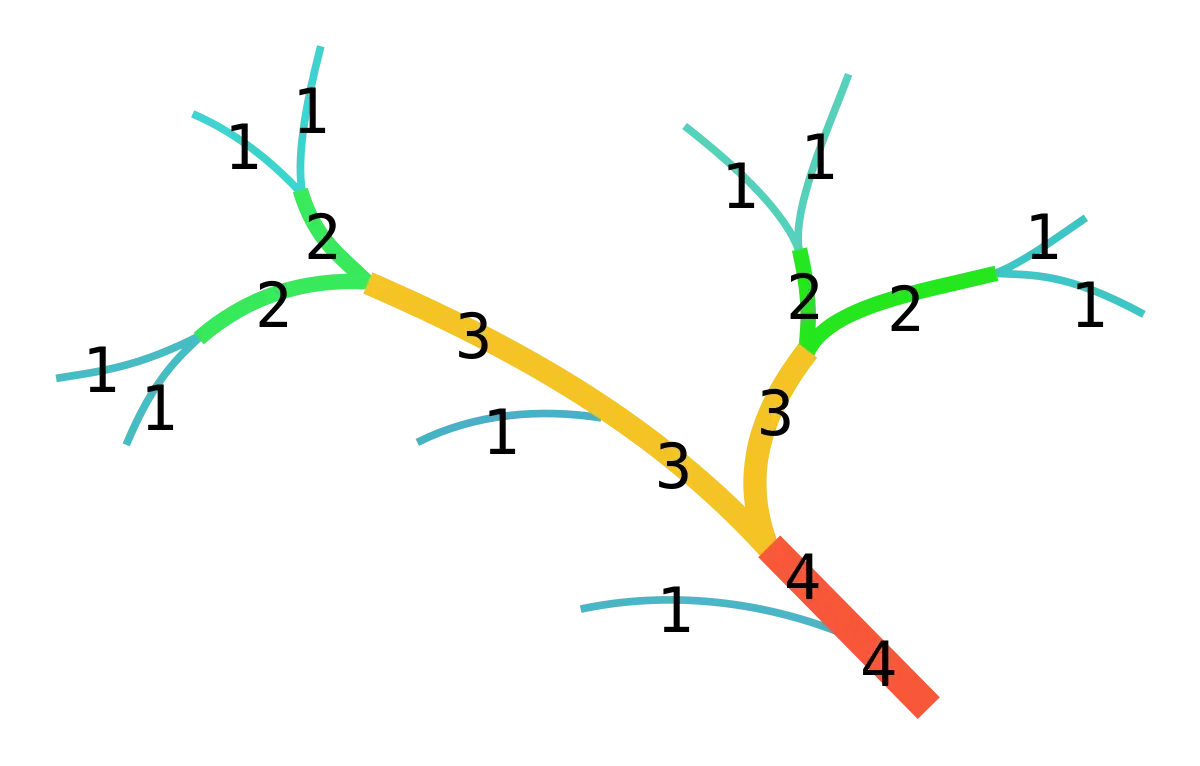
Tree Diagram with Numbers -

Simple Flowchart Diagram -
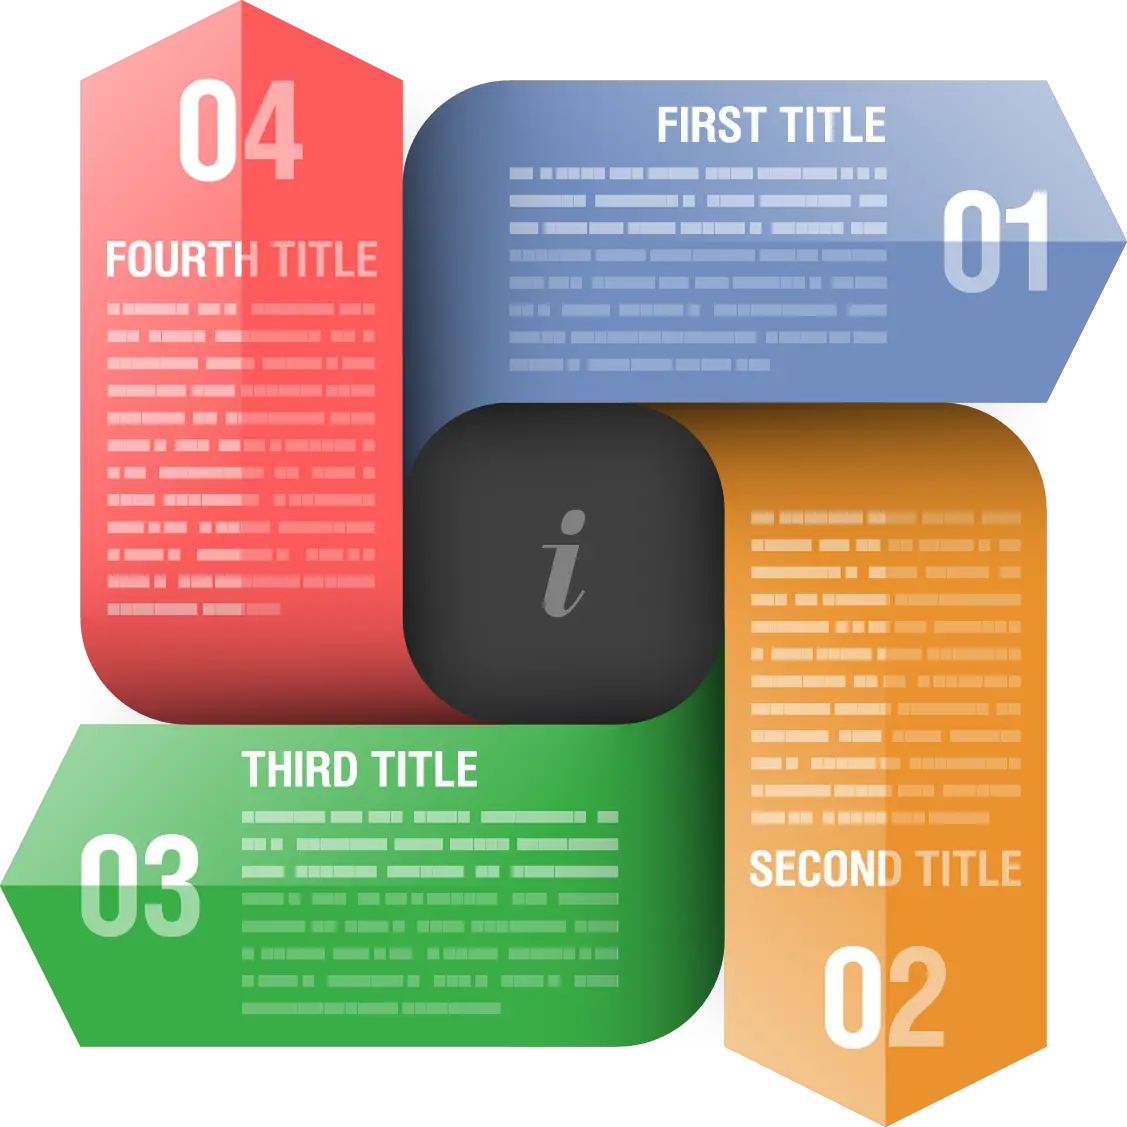
Colorful Infographic Diagram -
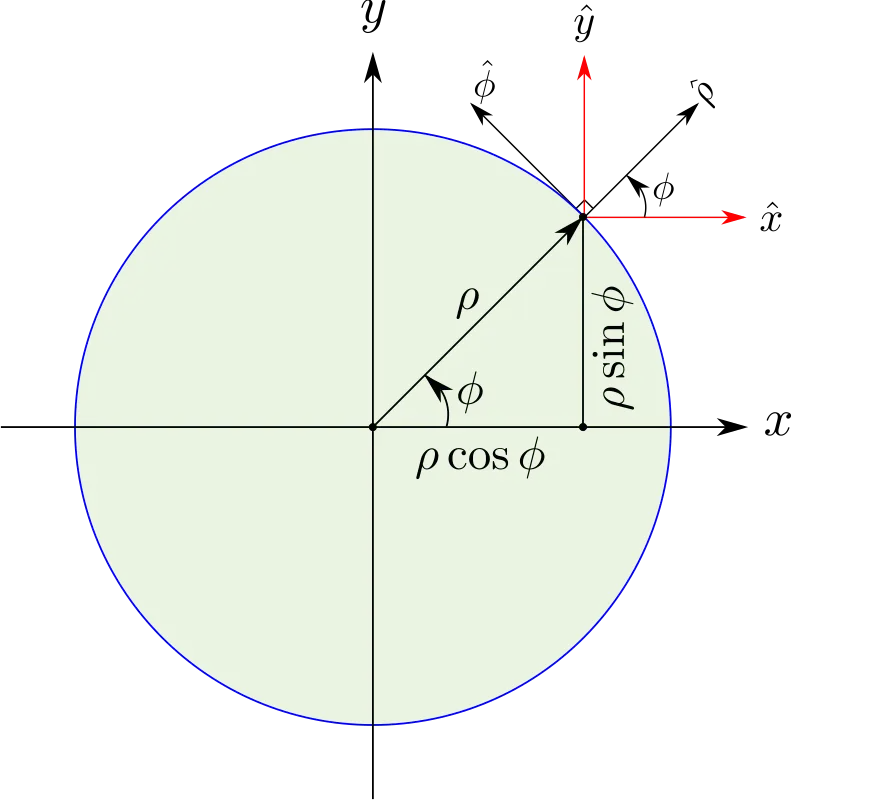
Polar Coordinate Diagram for Mathematics -
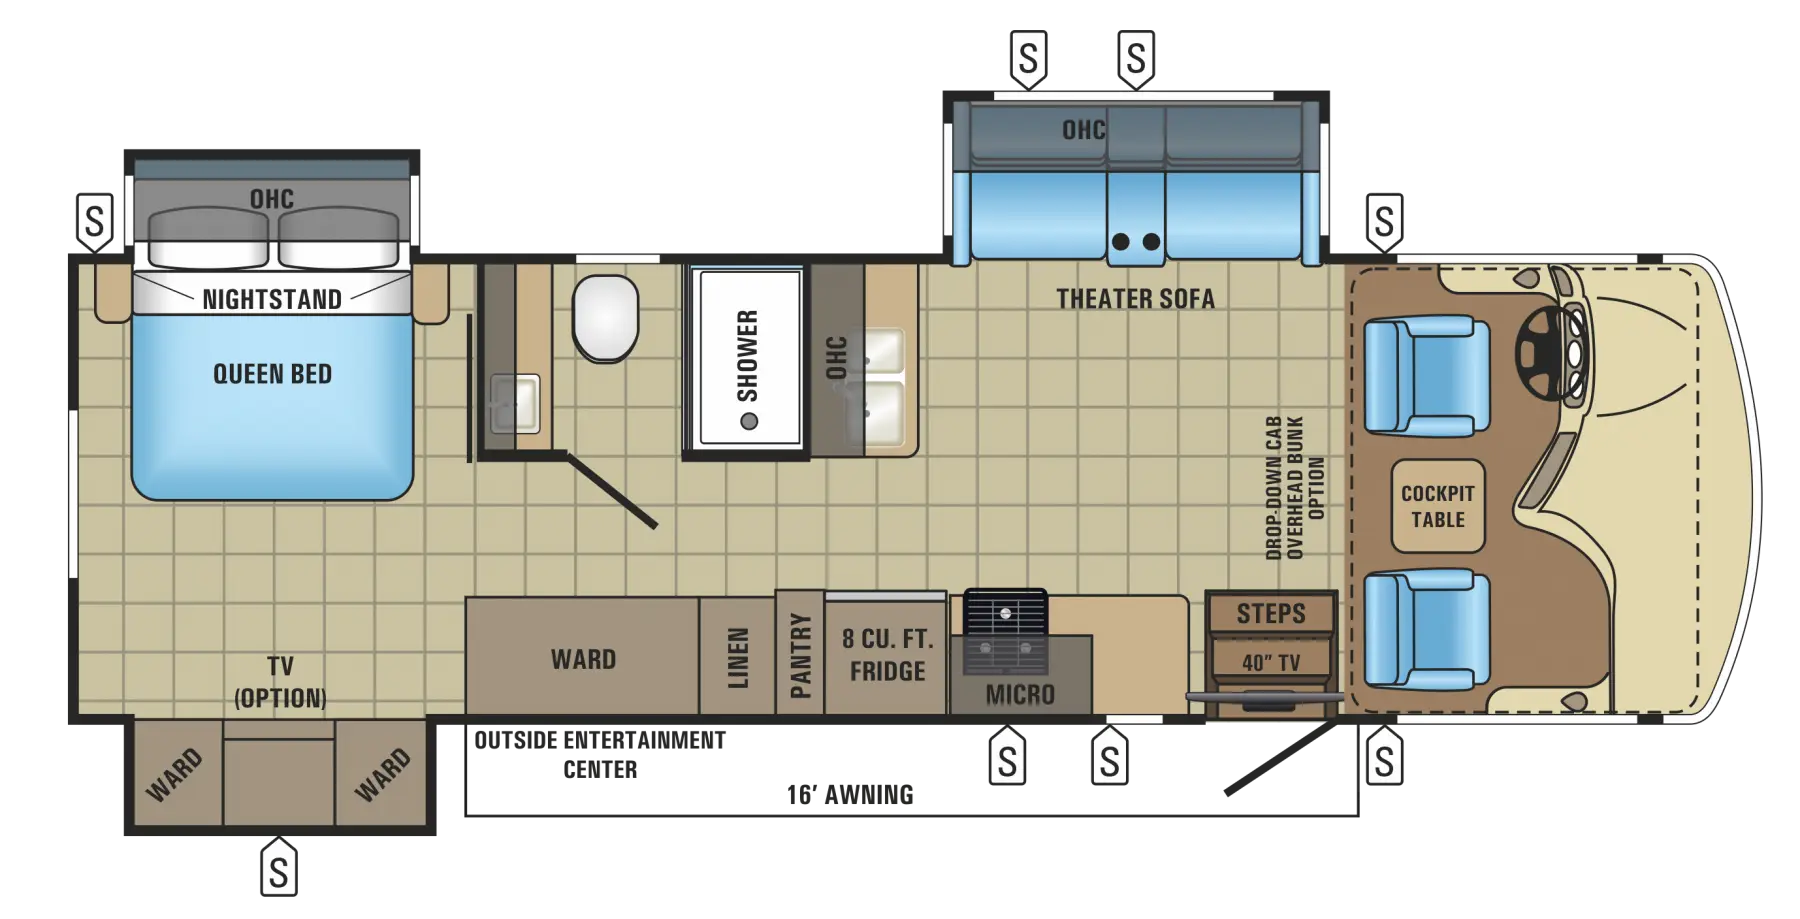
RV Floor Plan Layout Illustration -
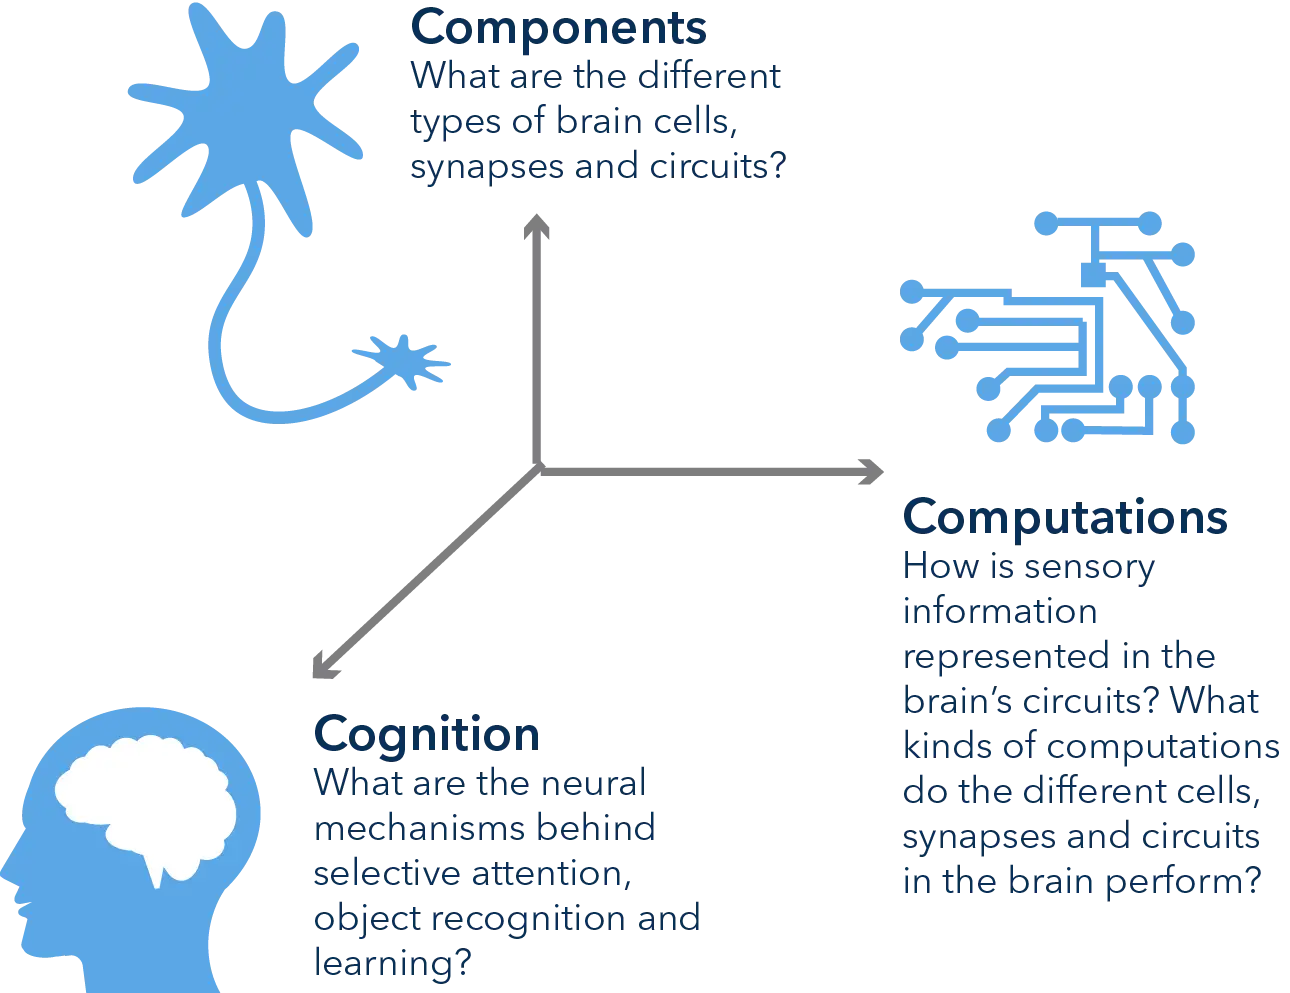
Brain Diagram for Educational Concept -

Molecular Chemical Structure Diagram -

Chemical Structure Diagram -
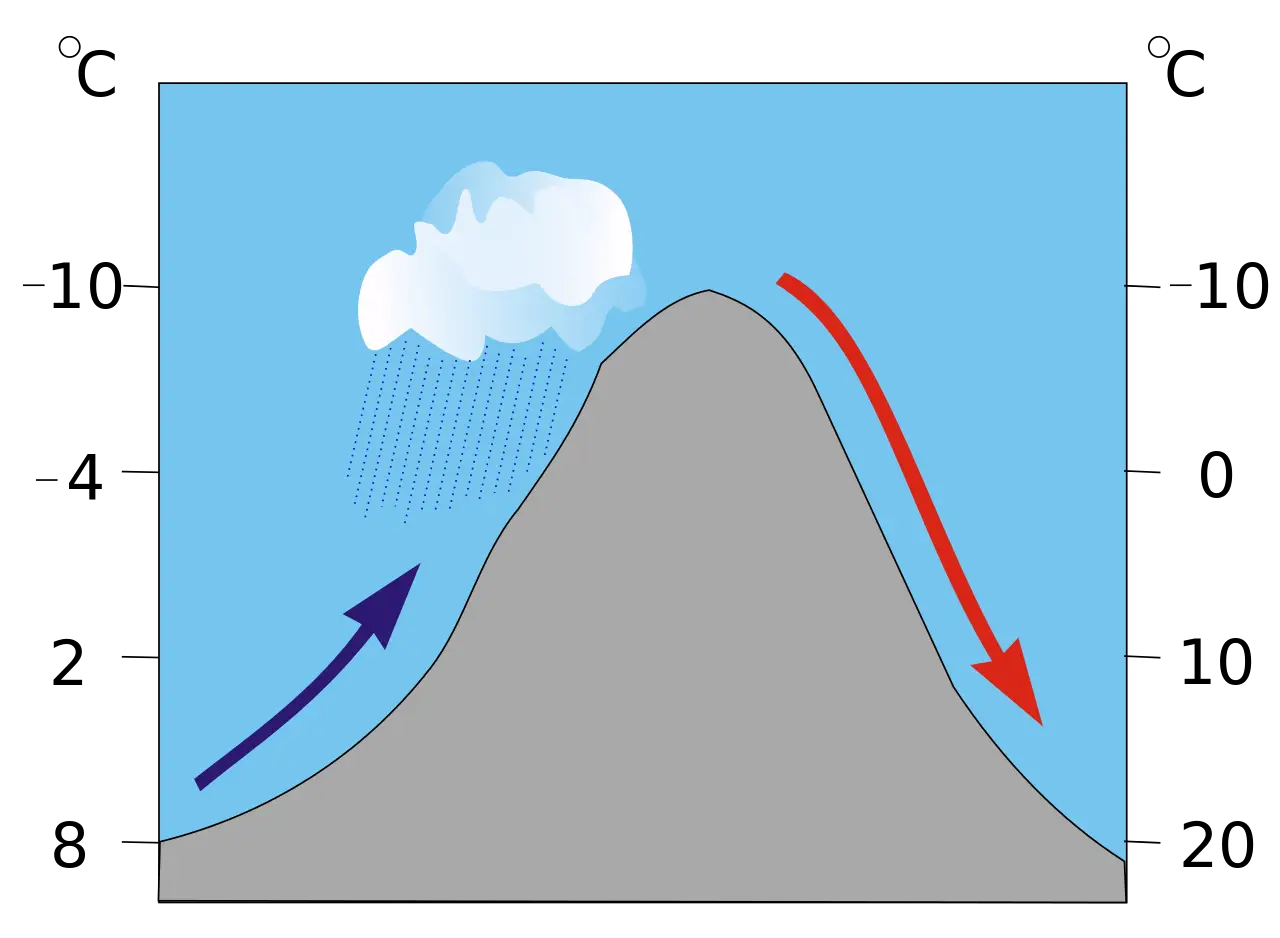
Weather Diagram with Temperature and Mountain -
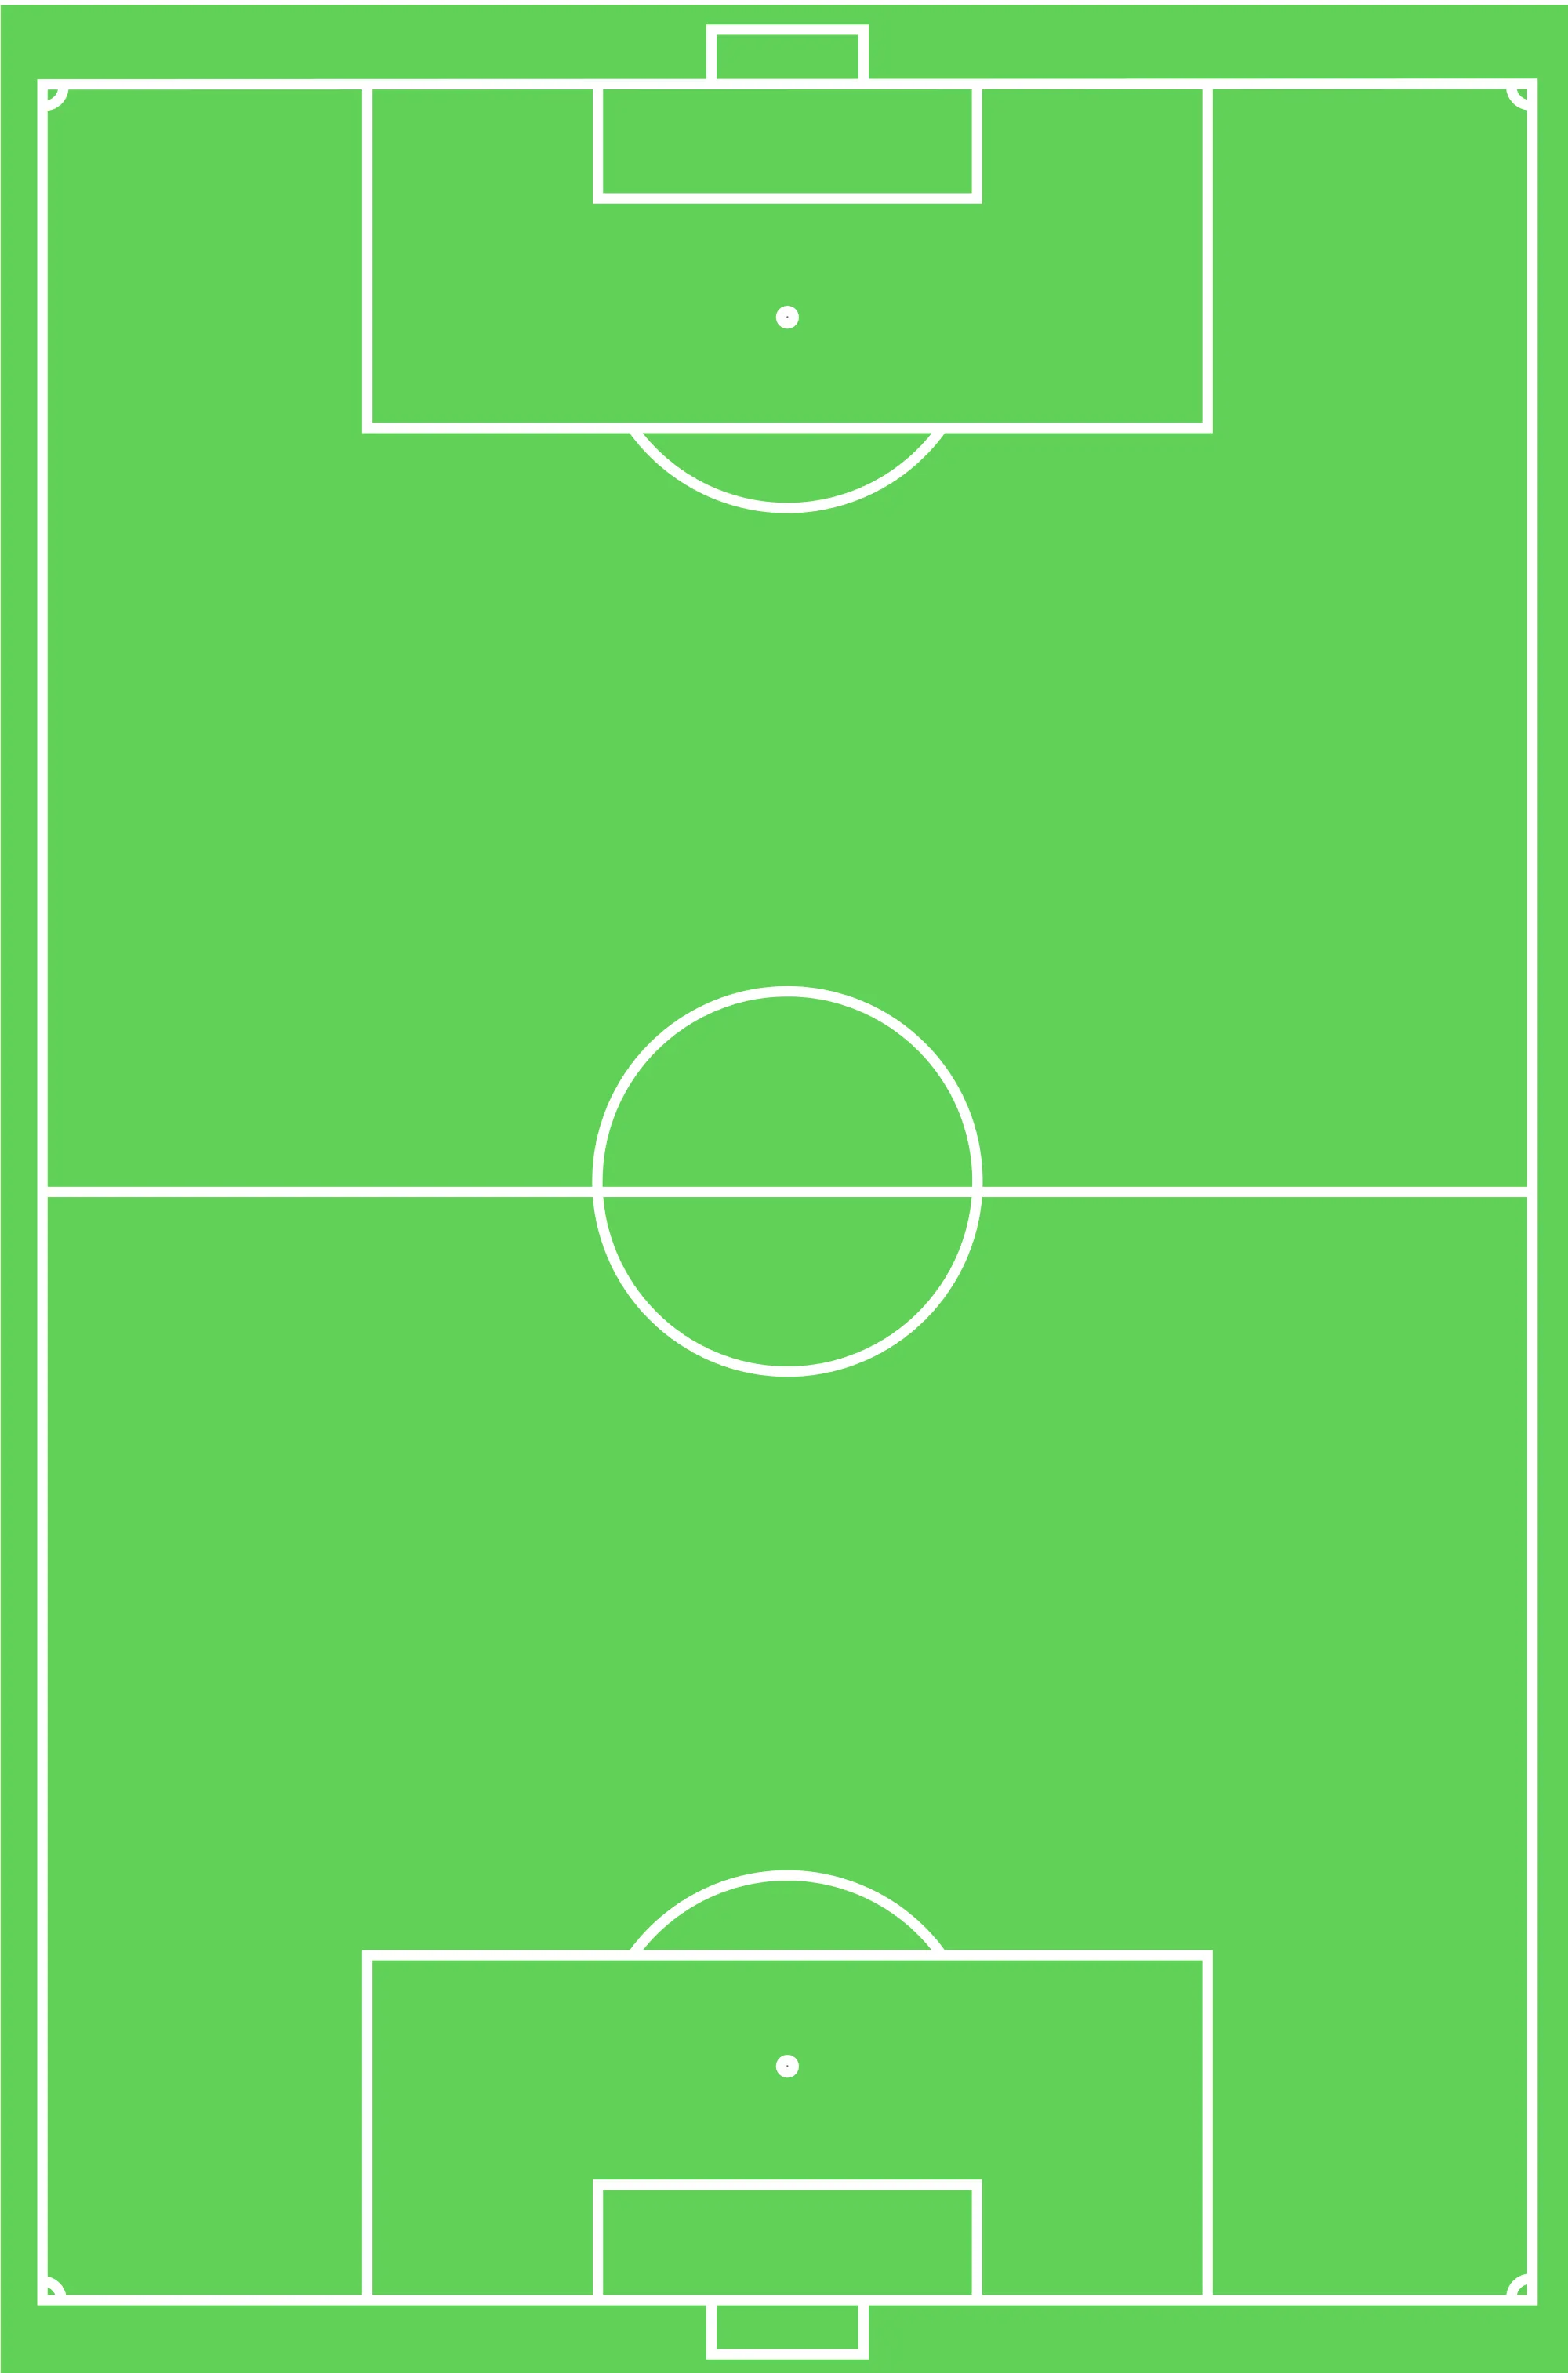
Soccer Field Diagram with Green Background -

Chemical Structure Diagram for Organic Compound -

Hexagon Numbered Infographic Template -
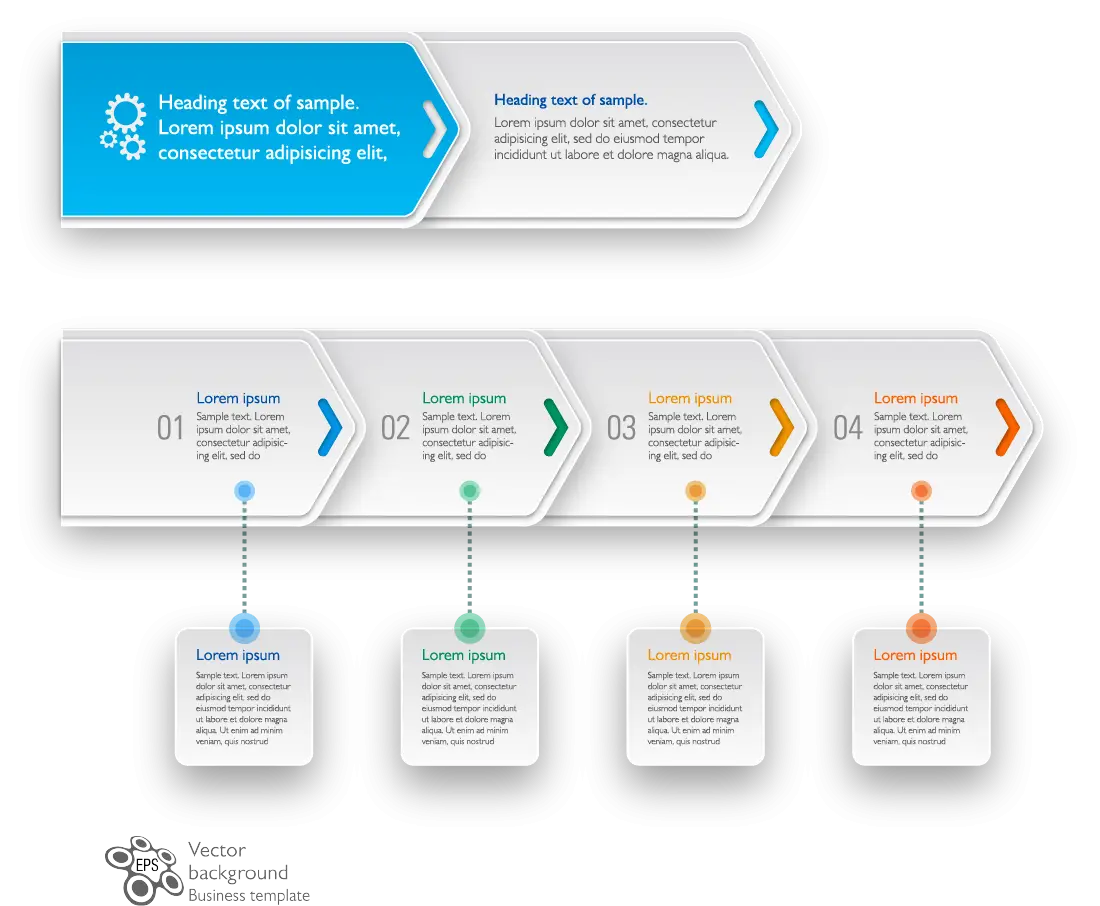
Infographic Arrows with Steps -
Transparent Floppy Disk Icon for Retro Tech Design -

LC Circuit Diagram -
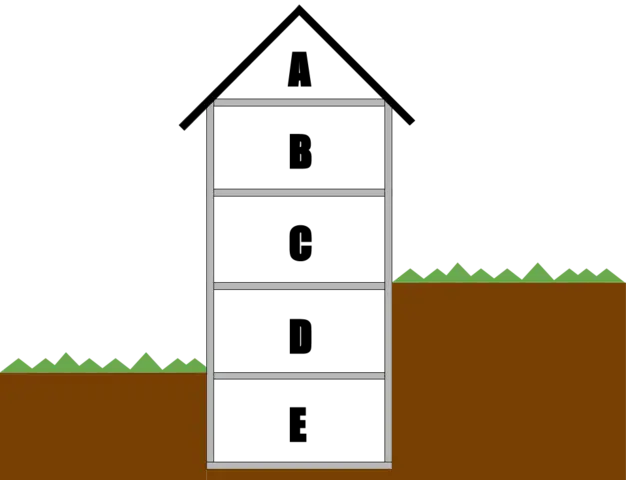
Diagram of Soil Layers -

Network Structure Diagram Connecting Nodes -

Website Sitemap Structure Diagram -

Flowchart Diagram -

Orange Molecular Structure Icon -

Blue Network Diagram Illustration