You Might Like
-

Person Waving in Formal Attire -

Election Voting Booth -
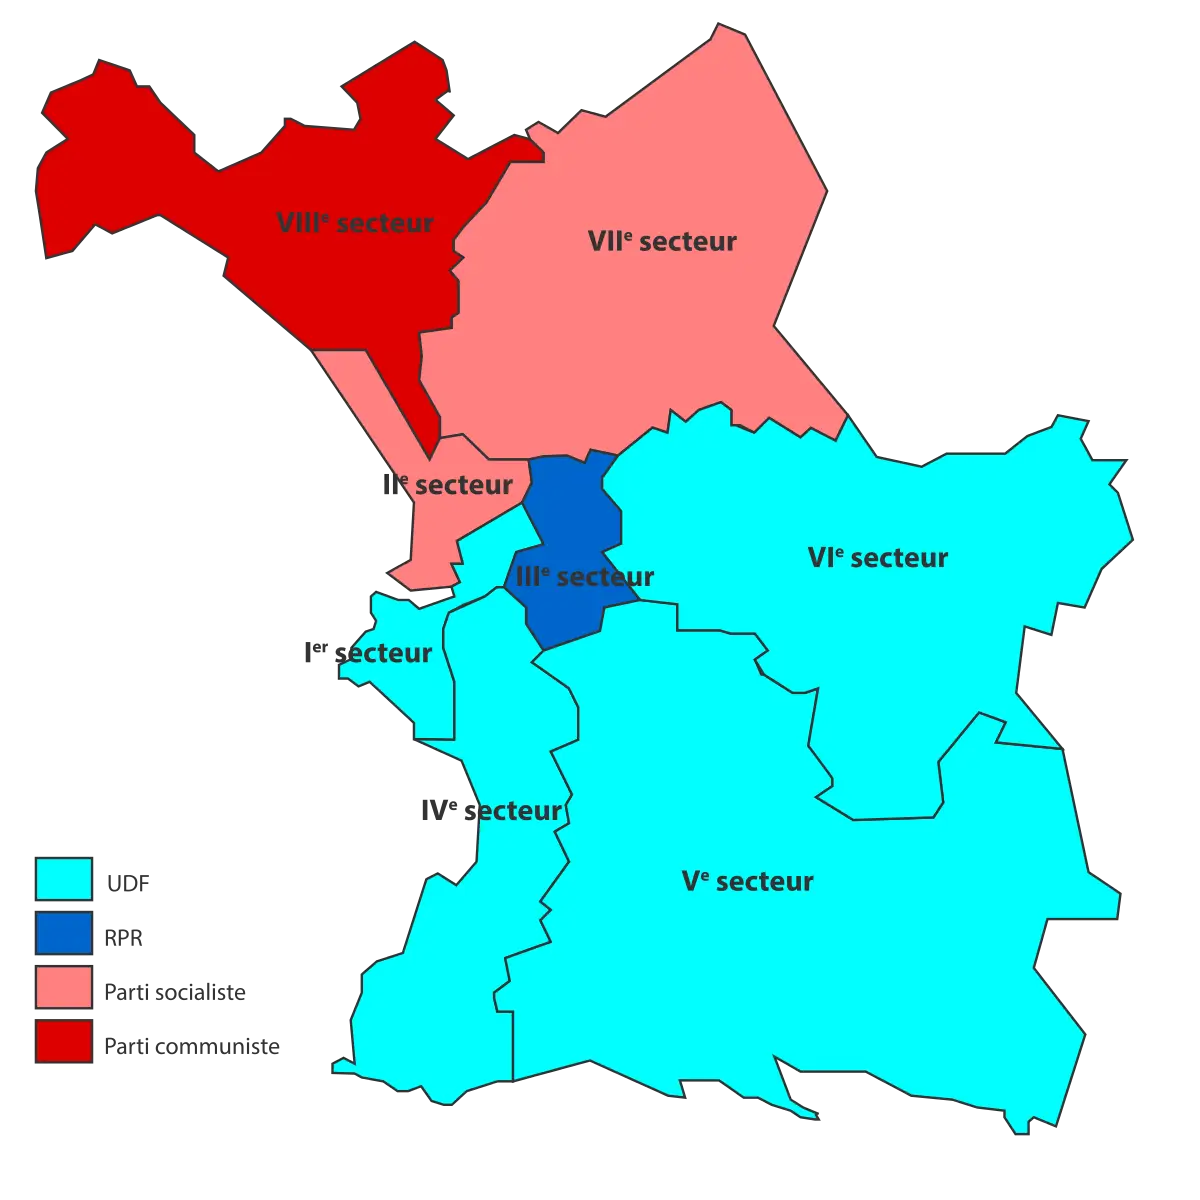
Political Map Displaying Regional Sectors -

Woman in Blue Blazer Speaking with Microphone -
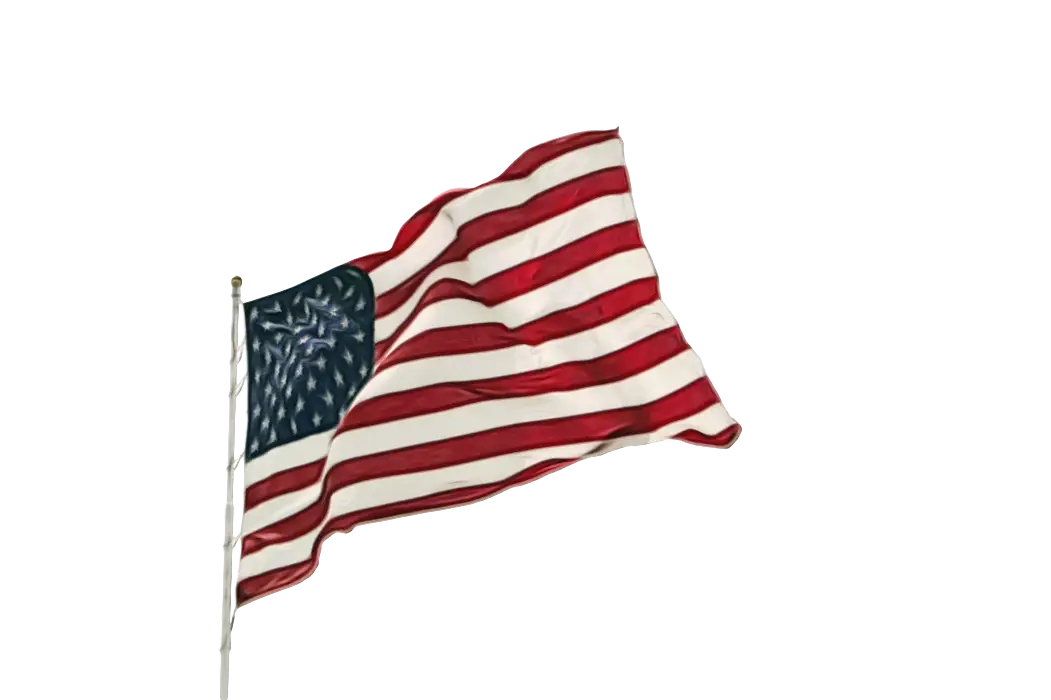
The Waving American Flag -

Black Anarchy Symbol in Circle -

Republican Elephant Party Logo -

Man Standing with Book -

Illustration Portrait of a Man in Suit -

Brexit Symbol -
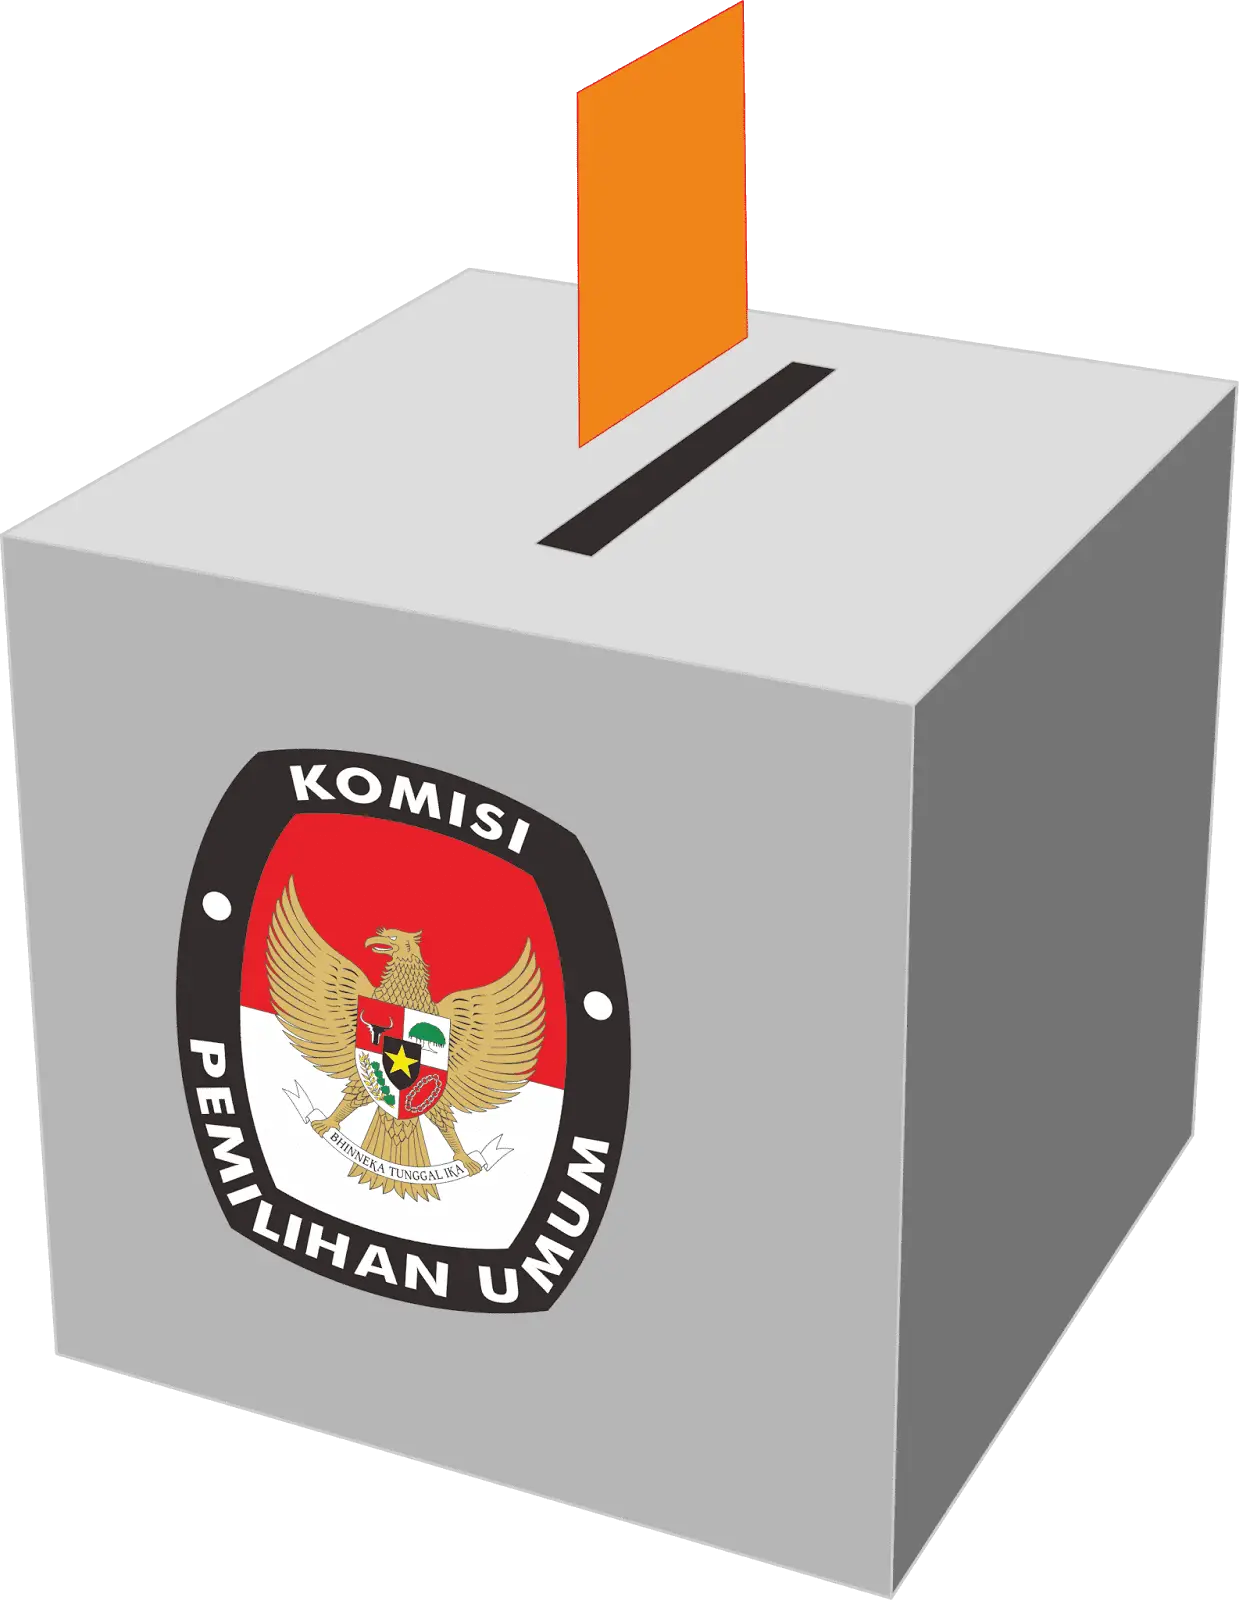
Election Ballot Box with Emblem -

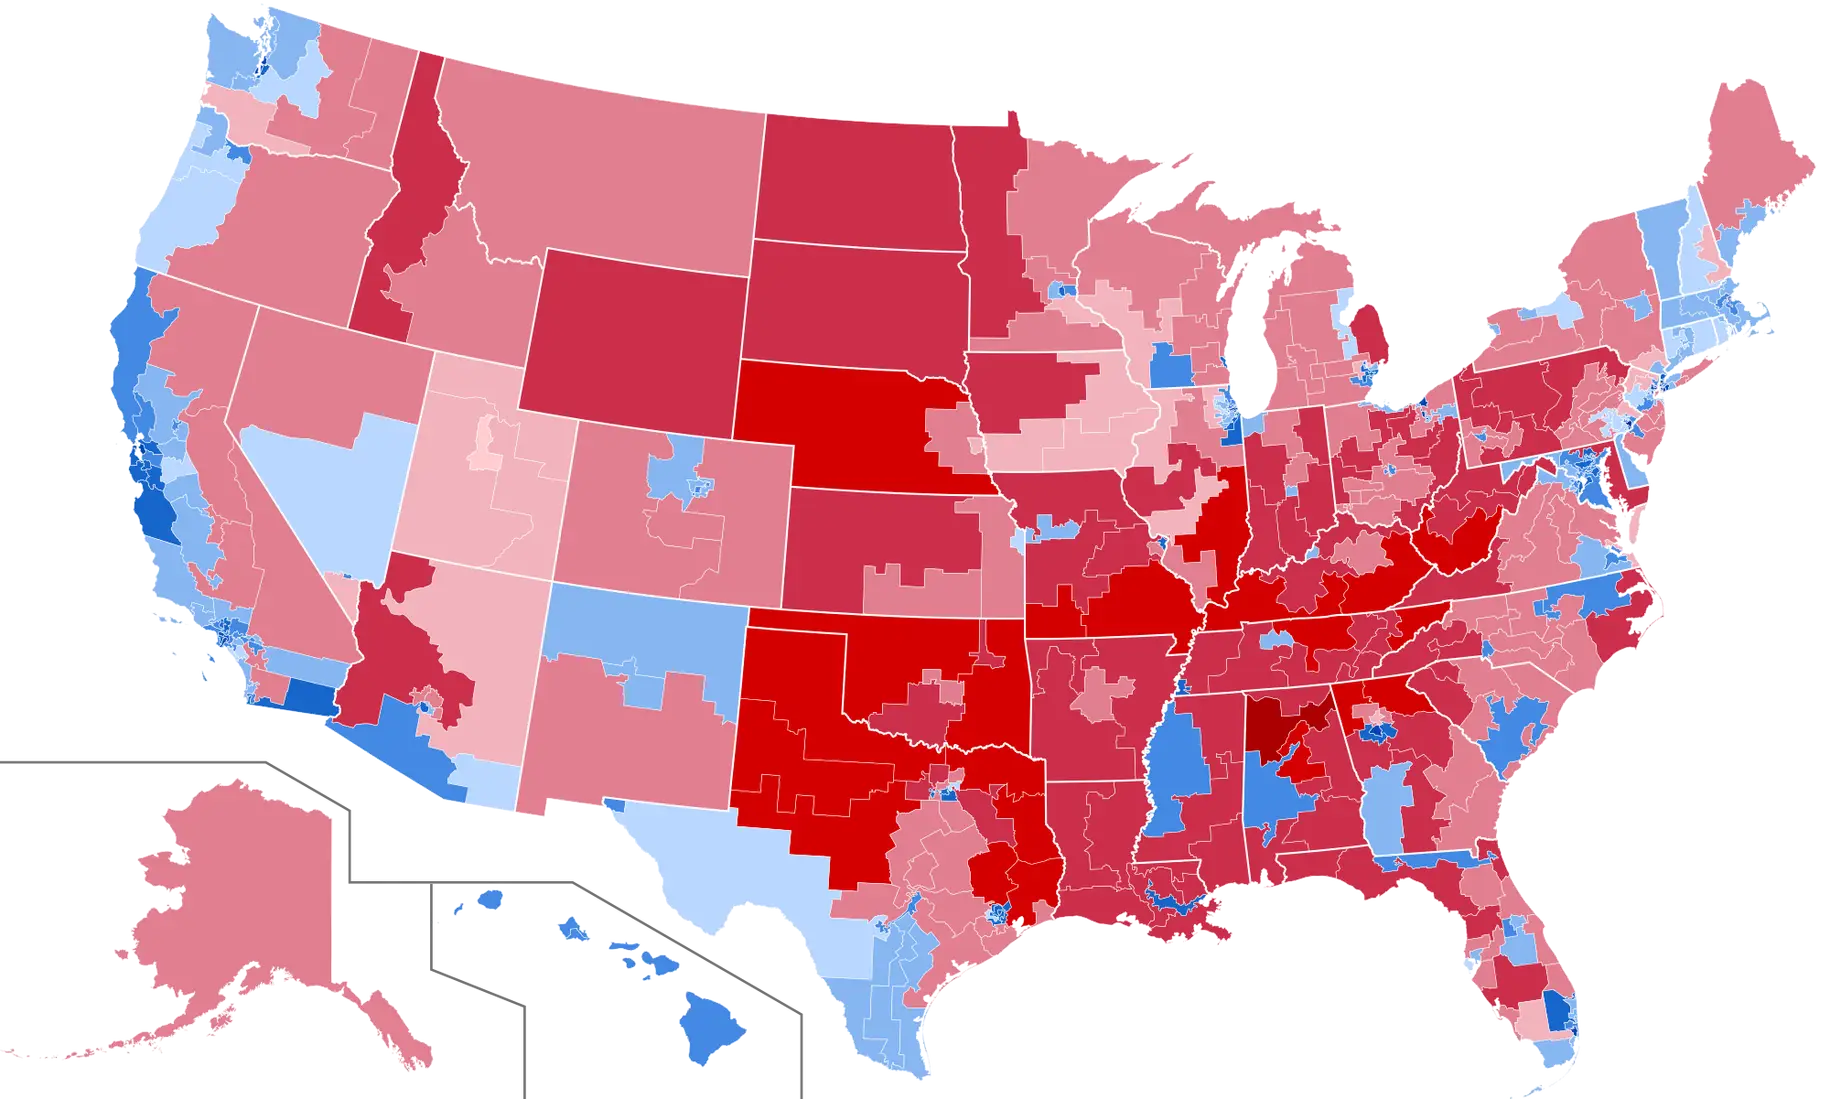
Gray USA Map Outline -

Yellow-Highlighted Face Graphic -

Indonesian Election Simulation -

Heart and Text Logo Design -

Ballot Box Icon -

PDI Perjuangan Logo -

Circular United States Flag Illustration -
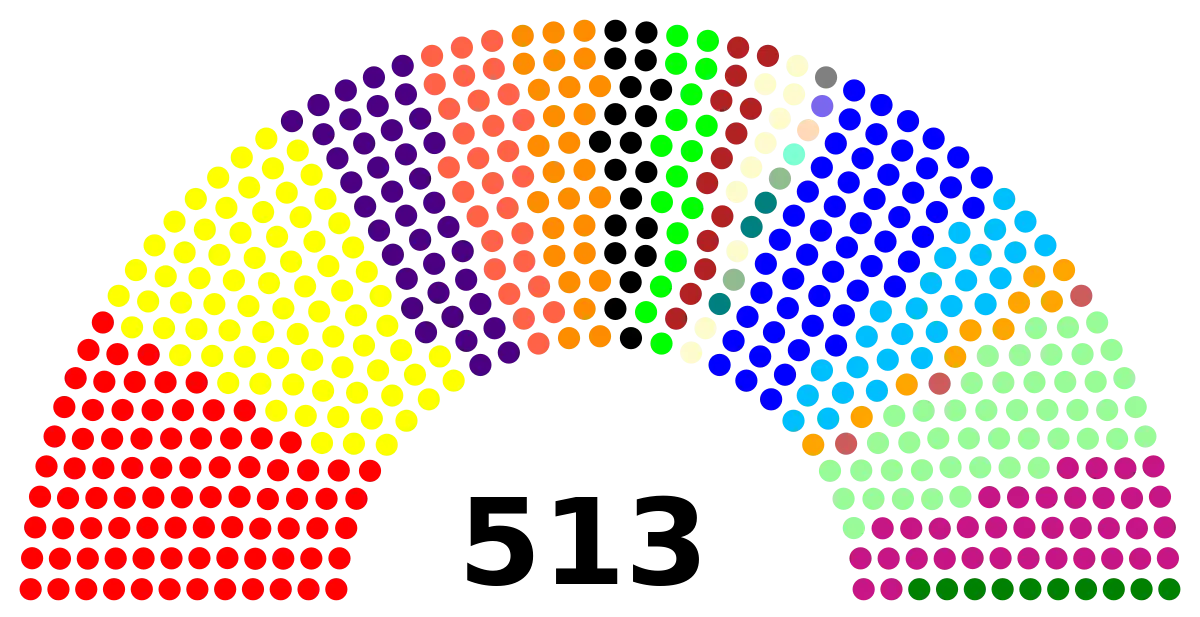
Colorful Parliament Seating Graph Illustration -
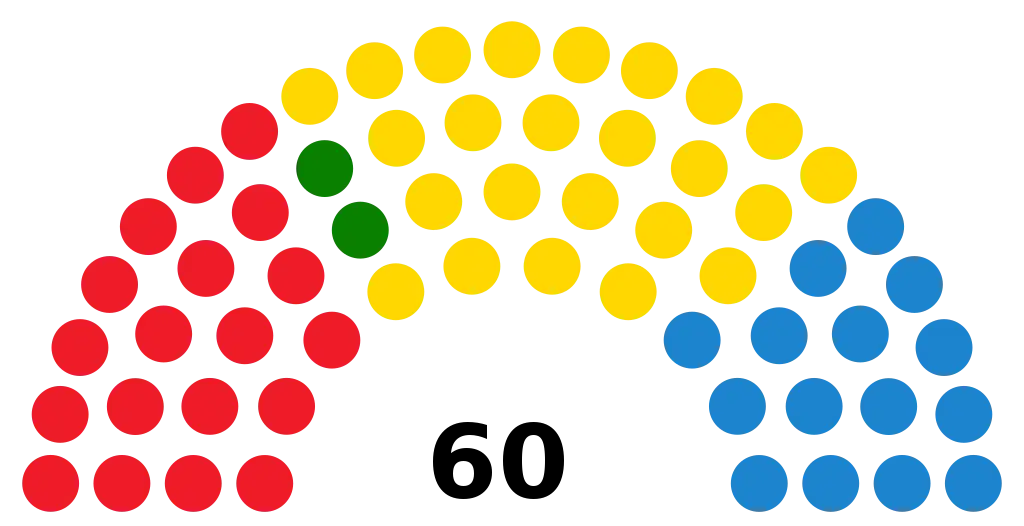
Parliament Seat Distribution Map Illustration -

U.S. Air Force Logo Design -

Circular USA Flag Button Icon -
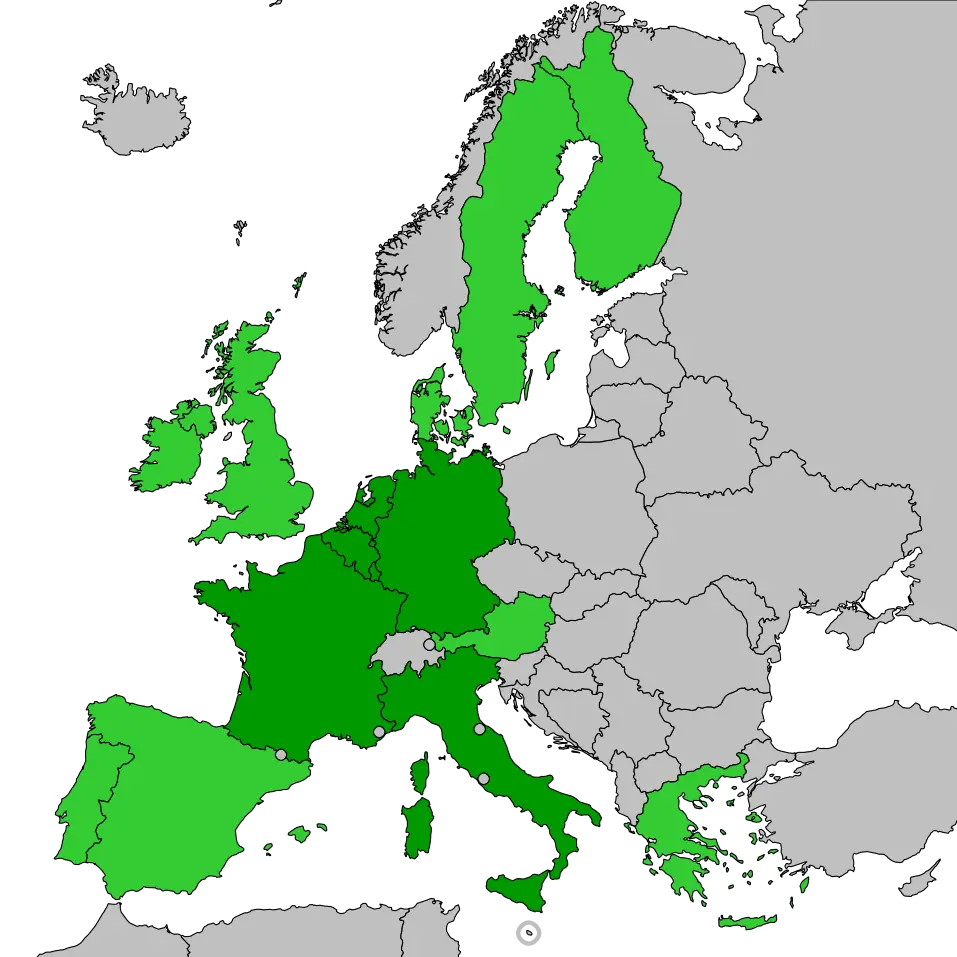
Map of Europe with Highlighted Areas -
Rose Gold Vote Box Icon for Elections and Participation -

Colorful Parrot Kite Illustration -

Red and Blue Pills -

Colorful Superhero in Dynamic Pose -

Voting Ballot in Flat Cartoon Style -

CP Football Club Logo Design -
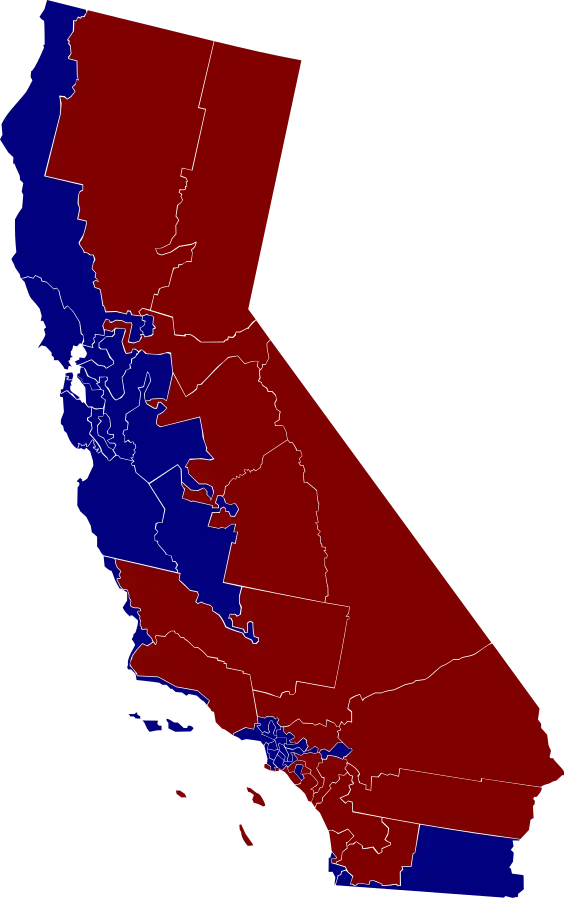
California Political Map Illustration