You Might Like
-

Zigzag Down Arrow Icon for Decline Representation -

Blue Declining Bar Graph with Arrow -

Circle Pie Chart Icon -

Declining Chart Illustration -

Magnifying Glass with Graph Illustration -
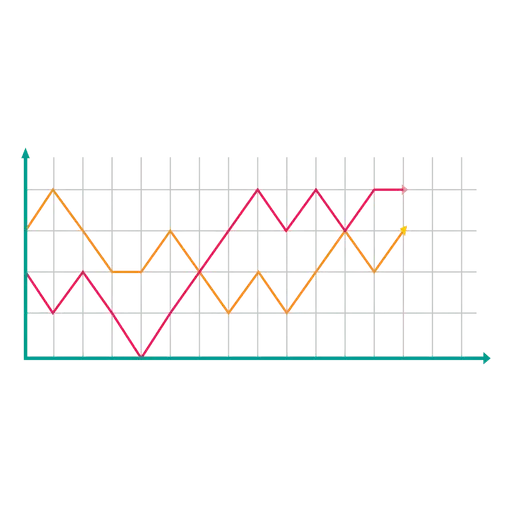
Line Graph for Data Visualization -

Bar Chart Icon for Data Analysis -

Red Downward Arrow Crashing -
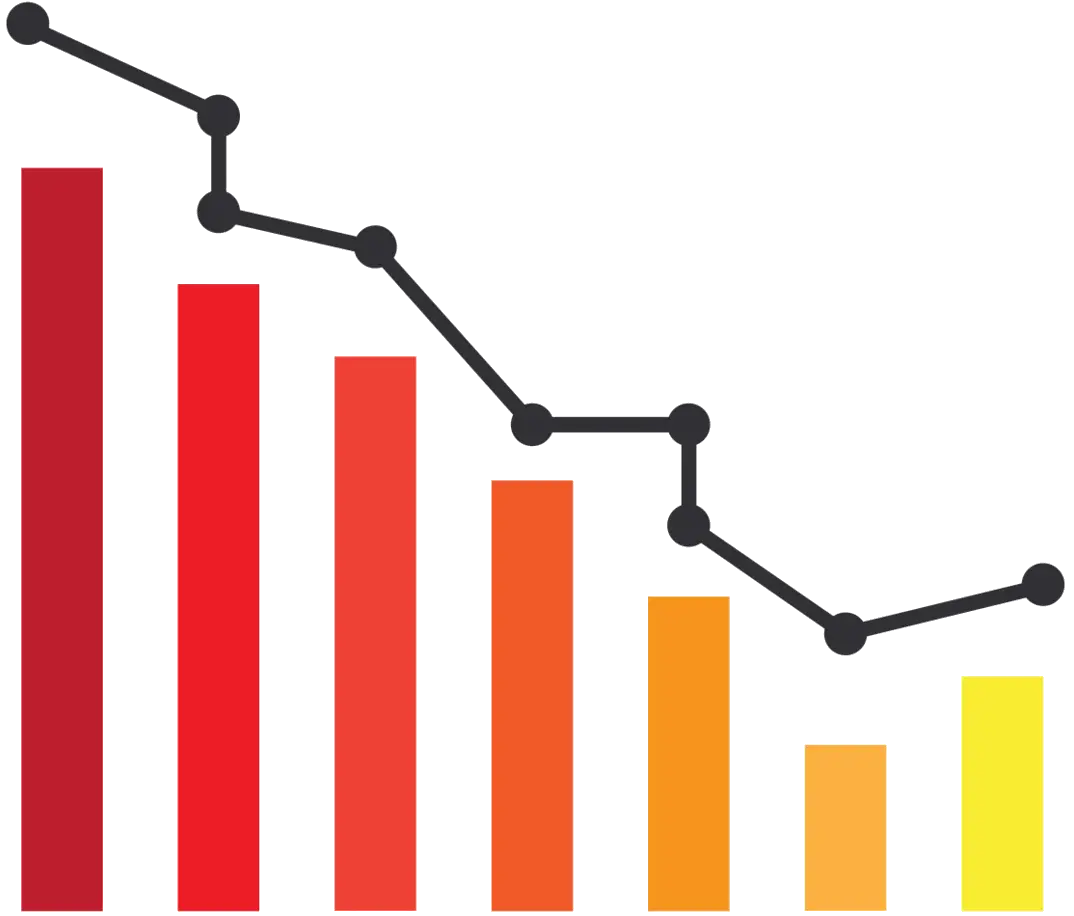
Colorful Descending Bar Graph Illustration -
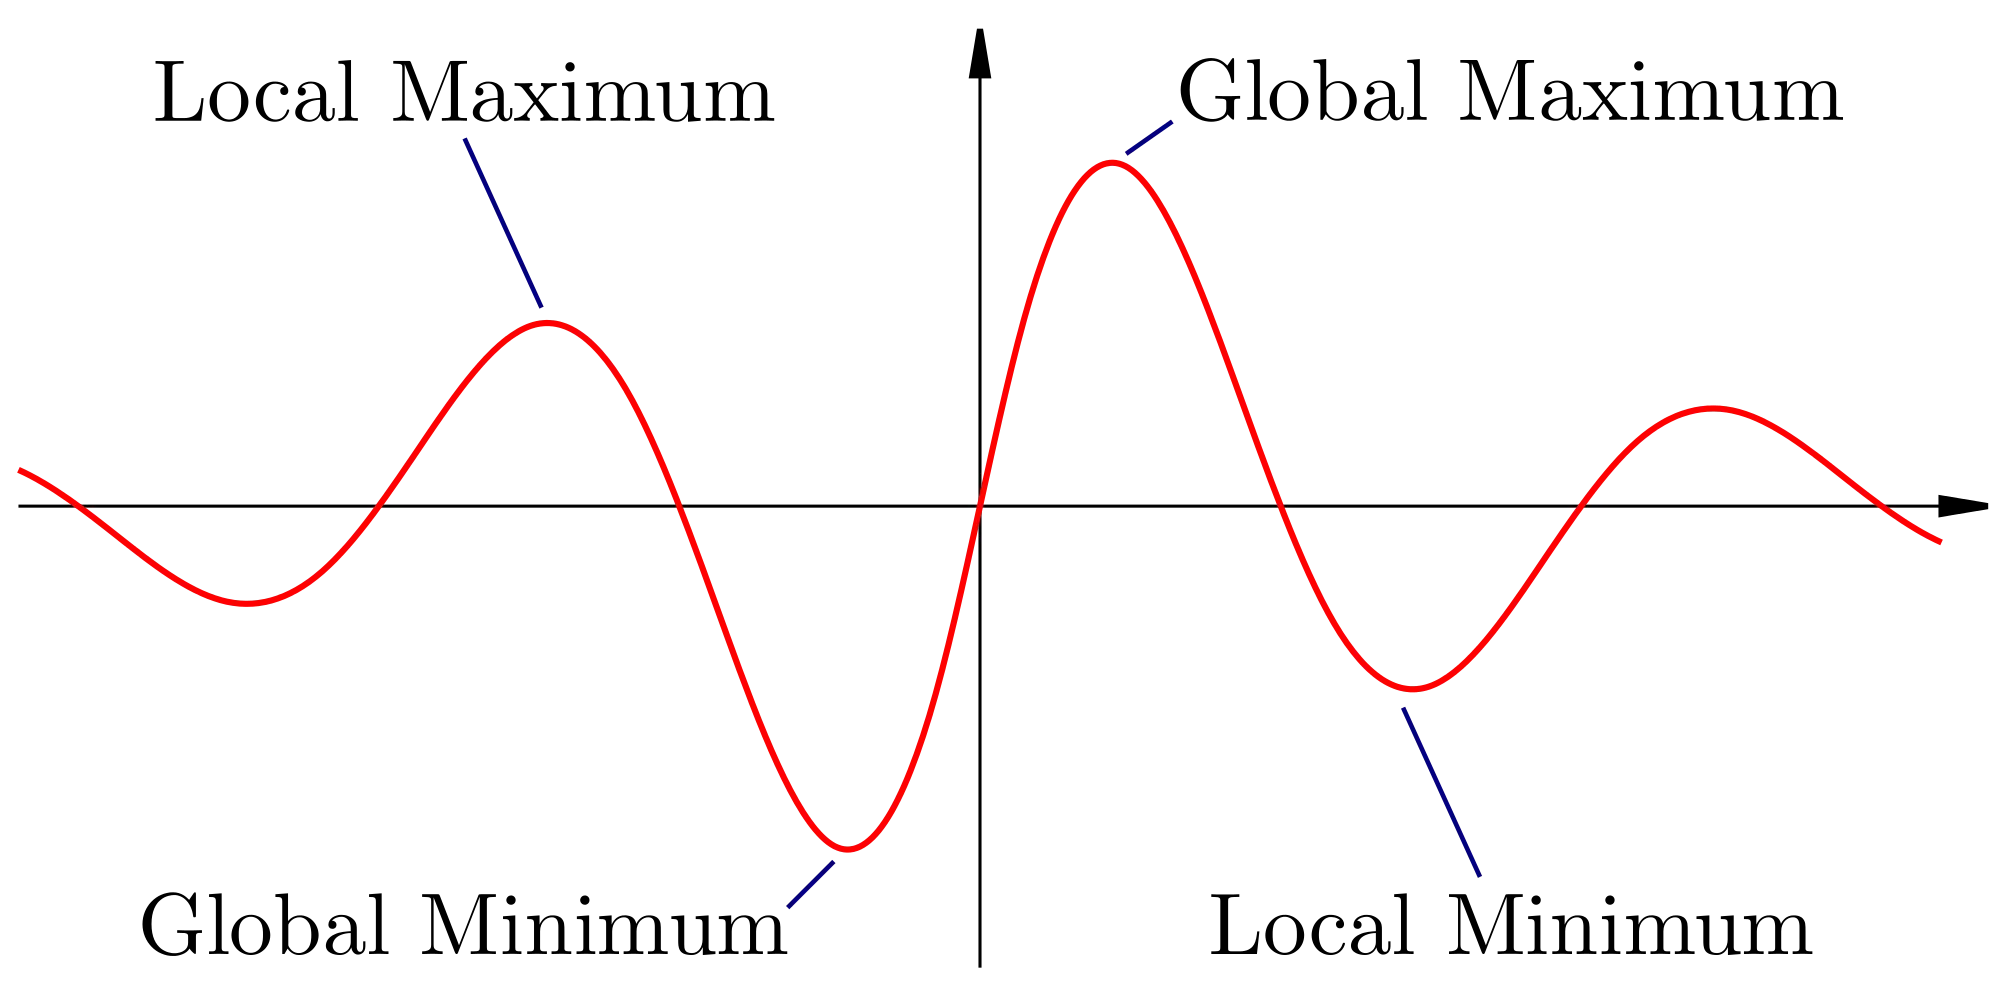
Graph with Local and Global Extrema -

Heartbeat Line with Falling Person -
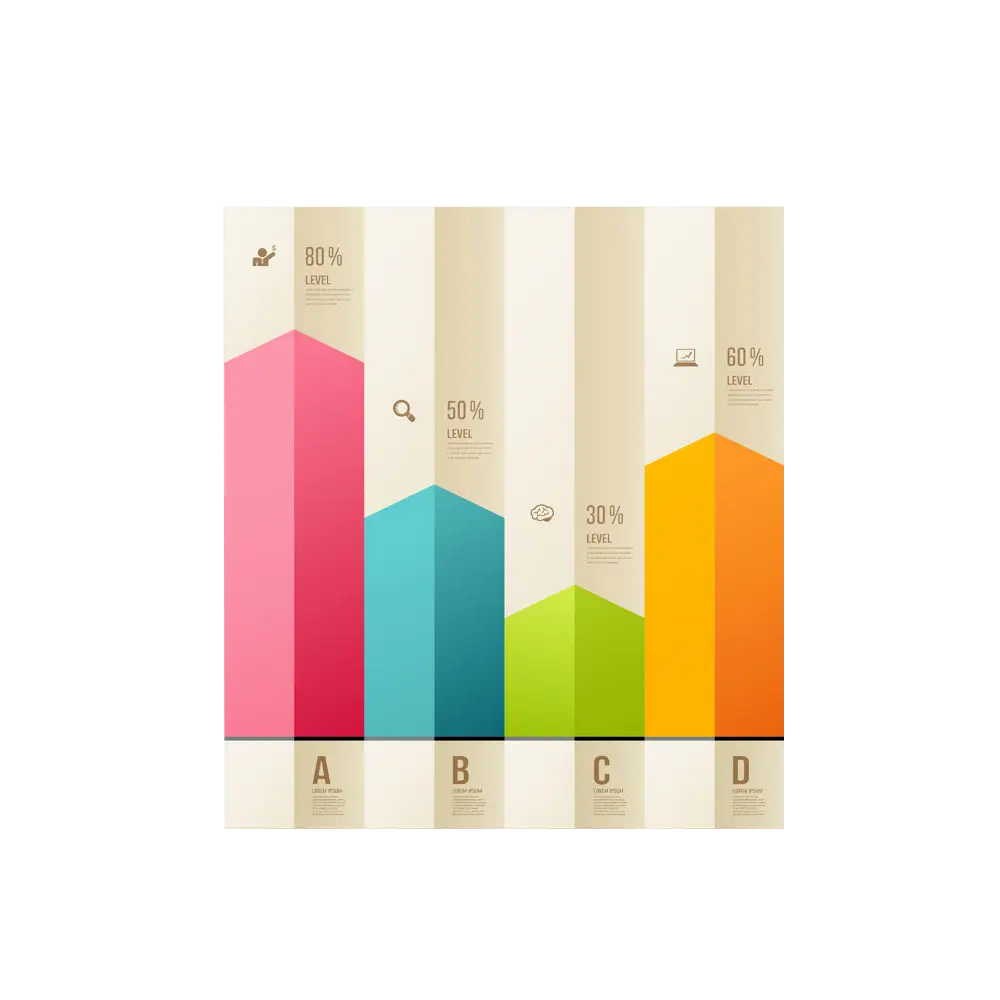
Colorful Bar Chart Infographic -

Exact vs Series Data Graph -

Network Structure Diagram Connecting Nodes -

Geometric Node and Edge Structure Illustration -
Simple Blue Bar Graph Chart Illustration -
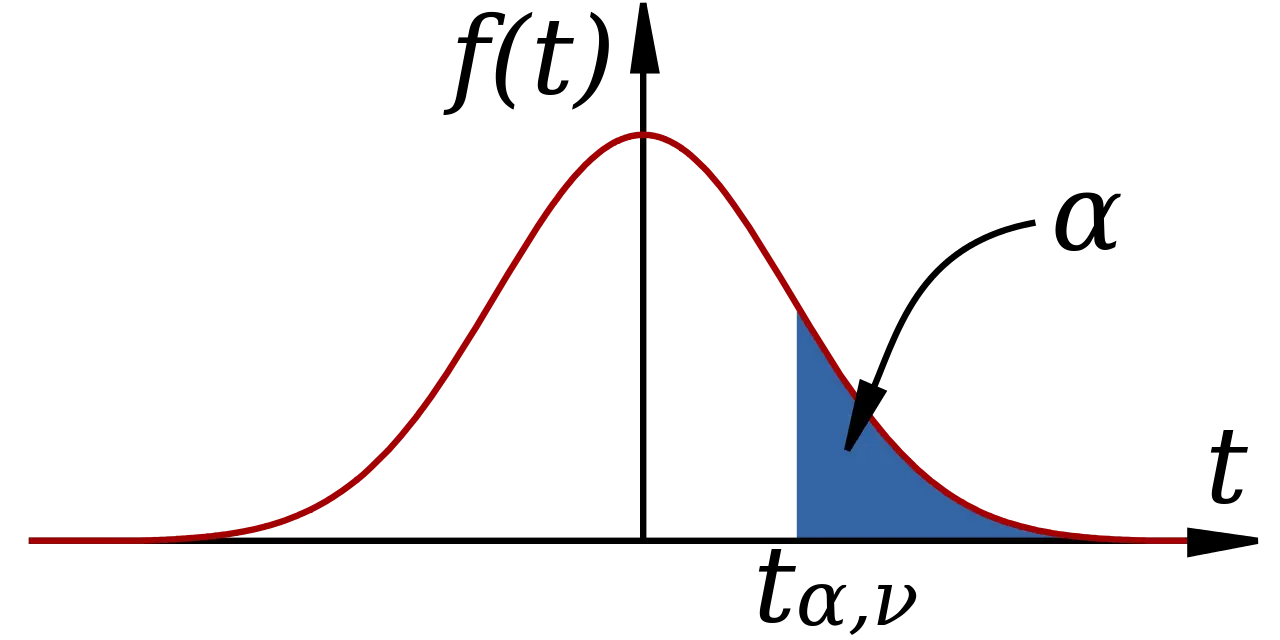
Mathematical Function Graph with Highlighted Area -
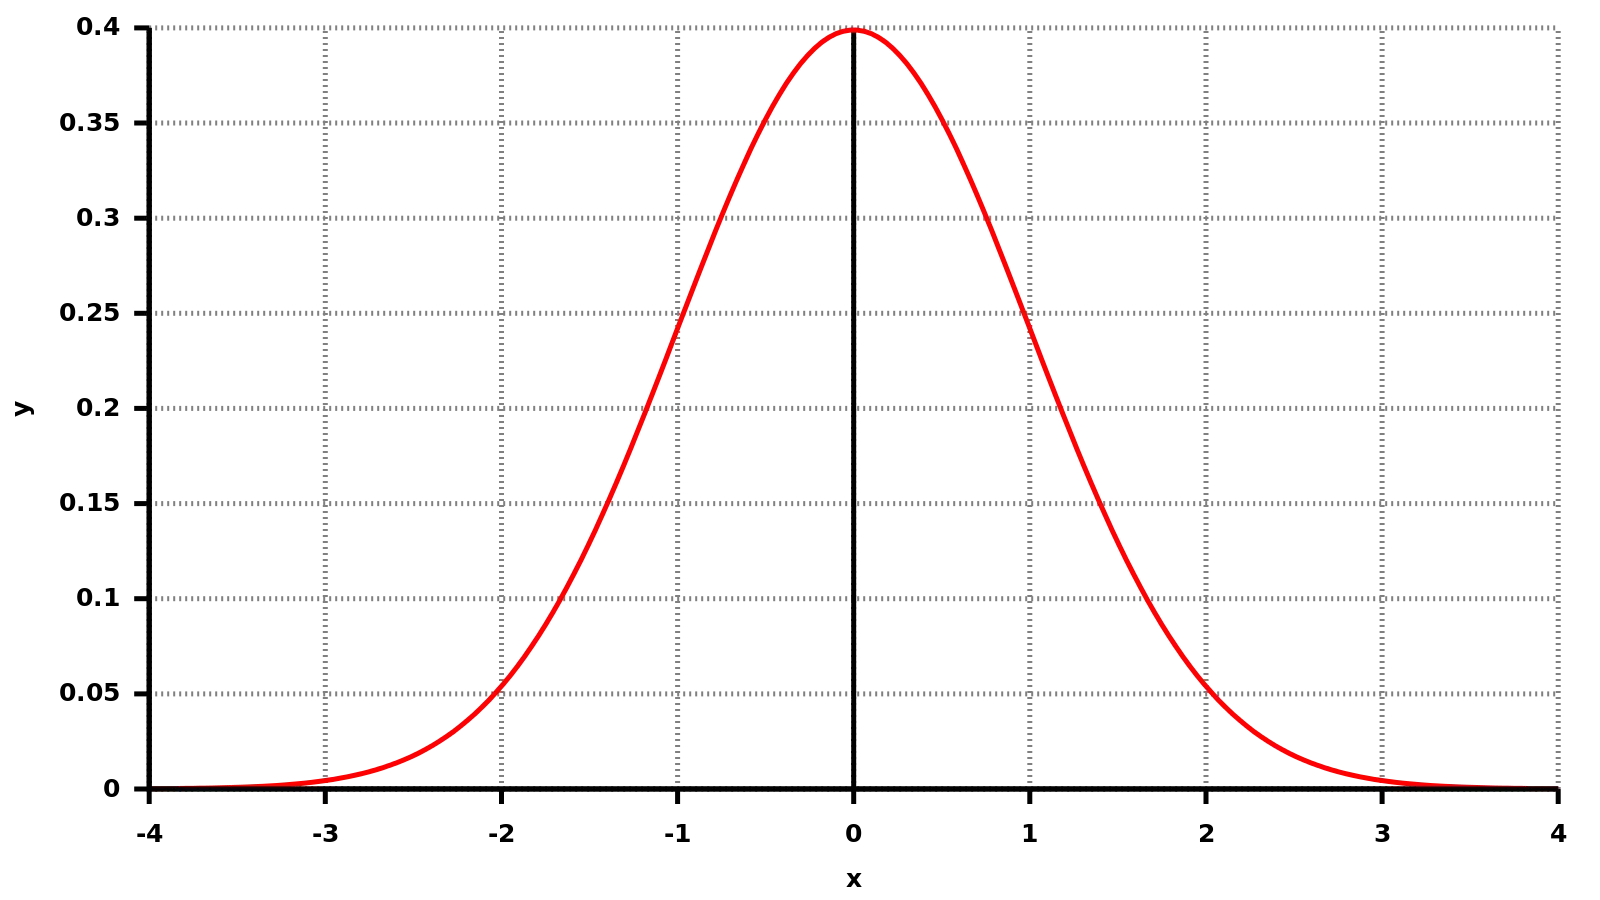
Bell Curve Graph for Statistics -

Hand-drawn Bar Chart Illustration -
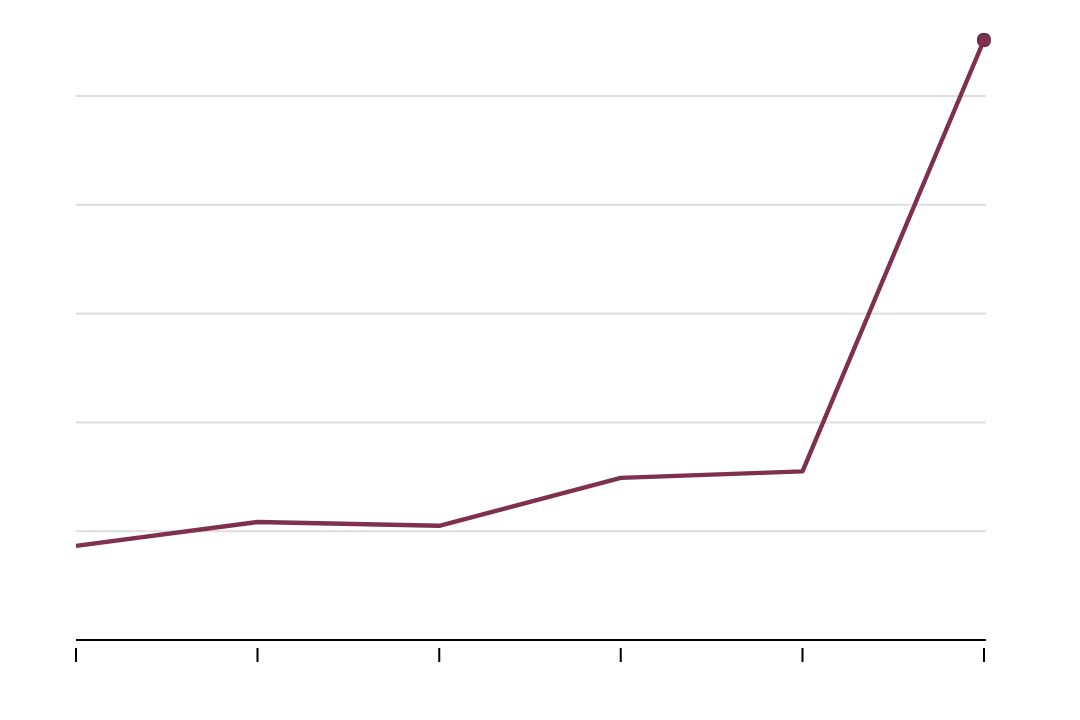
Line Graph Showing a Rising Data Trend -

Simple Pie Chart -

Green Downward Trend Graph Icon -

Red Line Graph Representation -
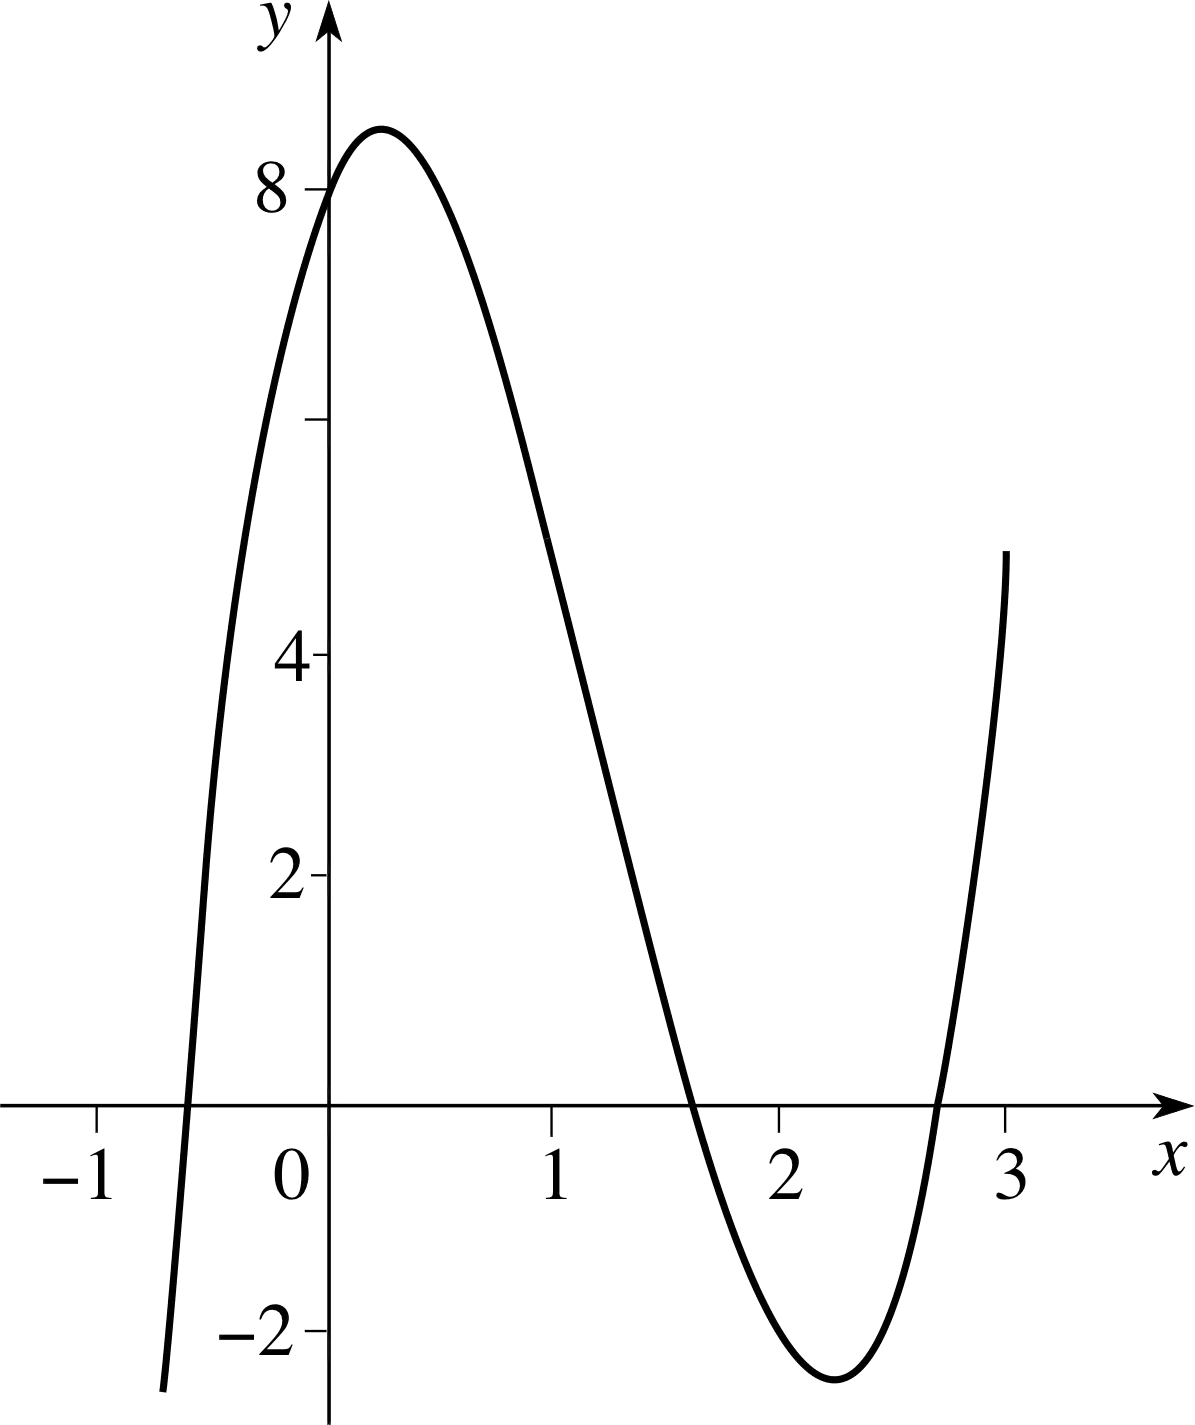
Mathematical Graph Curve on Coordinate Axes -

Graph Illustration of Absolute Value Function -

Data Analysis Icon with Magnifying Glass and Bar Graph -

In Loving Memory Tribute with Angel Wings -

Red Line Chart with Upward Arrow -

Grey Pie Chart Icon Representing Data -
Rising Bar Graph Indicating Growth