You Might Like
-

Smart Home Control System with Temperature Display -

Cute Cartoon Clouds in Blue Sky -

Thermometer Symbol Icon -

Green Box with Arrows and Fire -
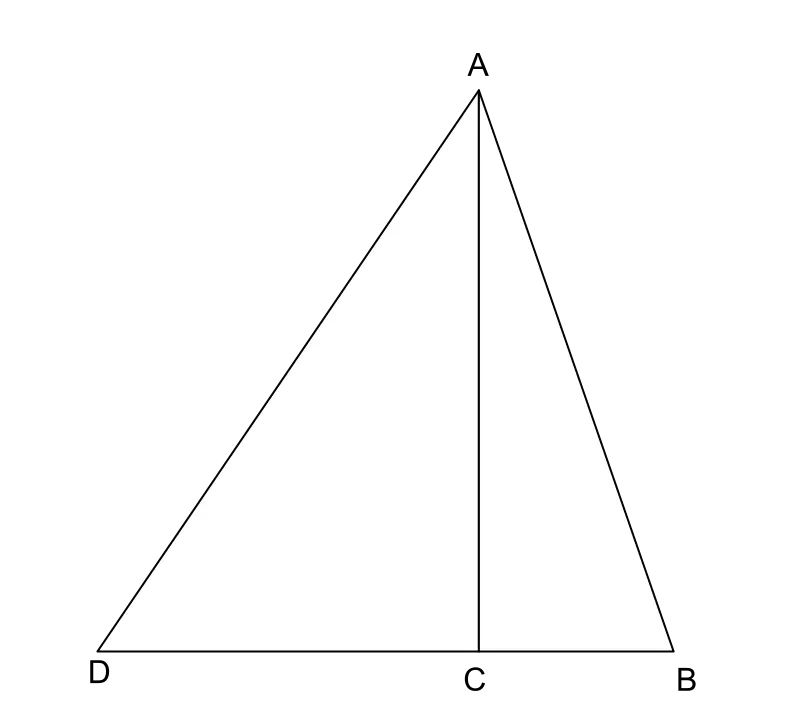
Triangle Diagram for Geometric Representation -

Orange Thermometer Icon Illustration -

Black and White Blood Pressure Monitor -
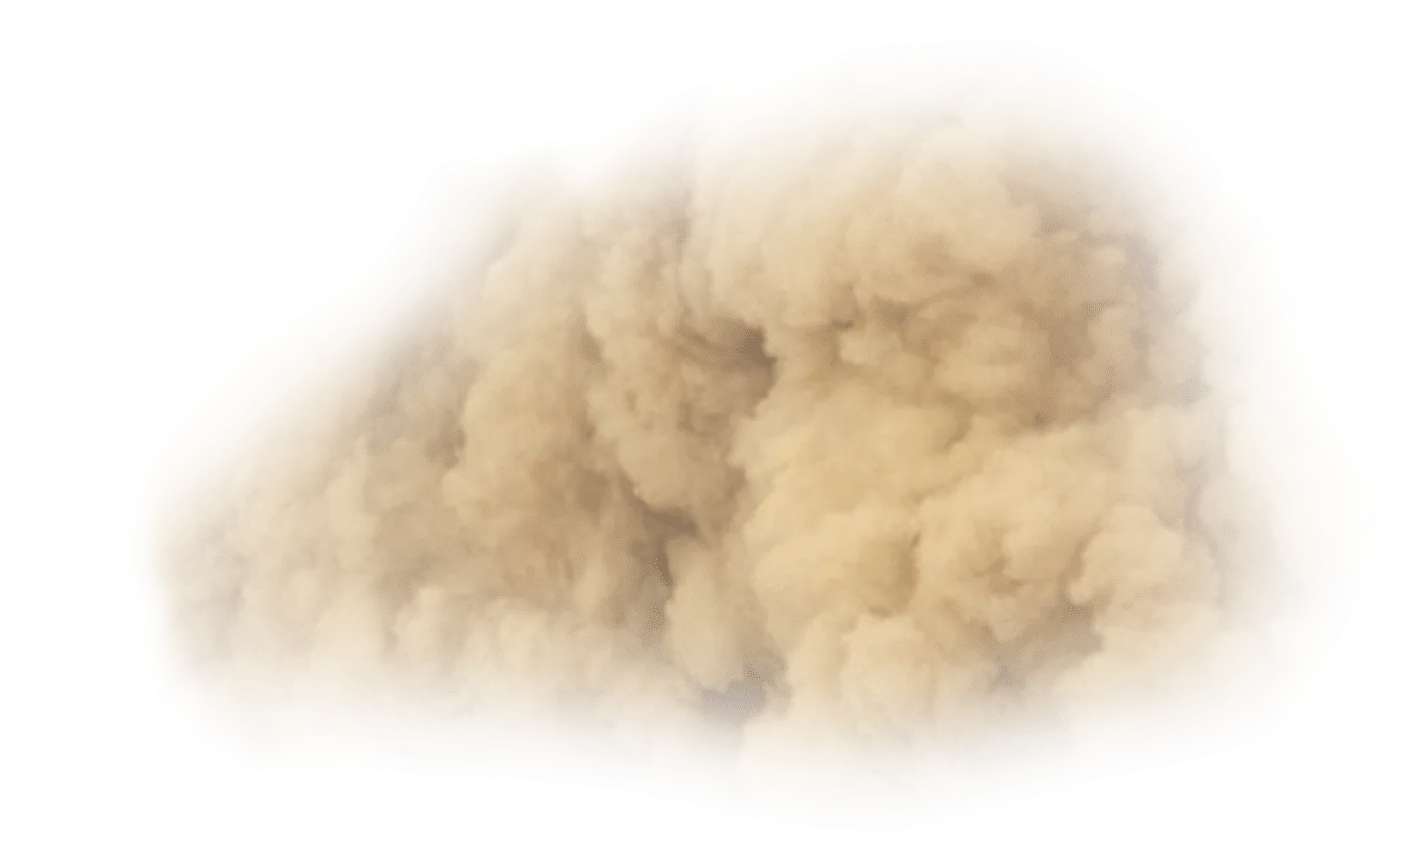
Dust Cloud Illustration -

Realistic Fluffy Cloud Illustration -

-

Cloudy Horizon with Soft Sky Illustration -

Sweating Face Icon with Thermometer -

Kidneys and Blood Pressure Monitor -

Black Thermometer Icon with Degree Symbol -

Celsius Symbol for Temperature Measurement -

Thermometer Icon Design -
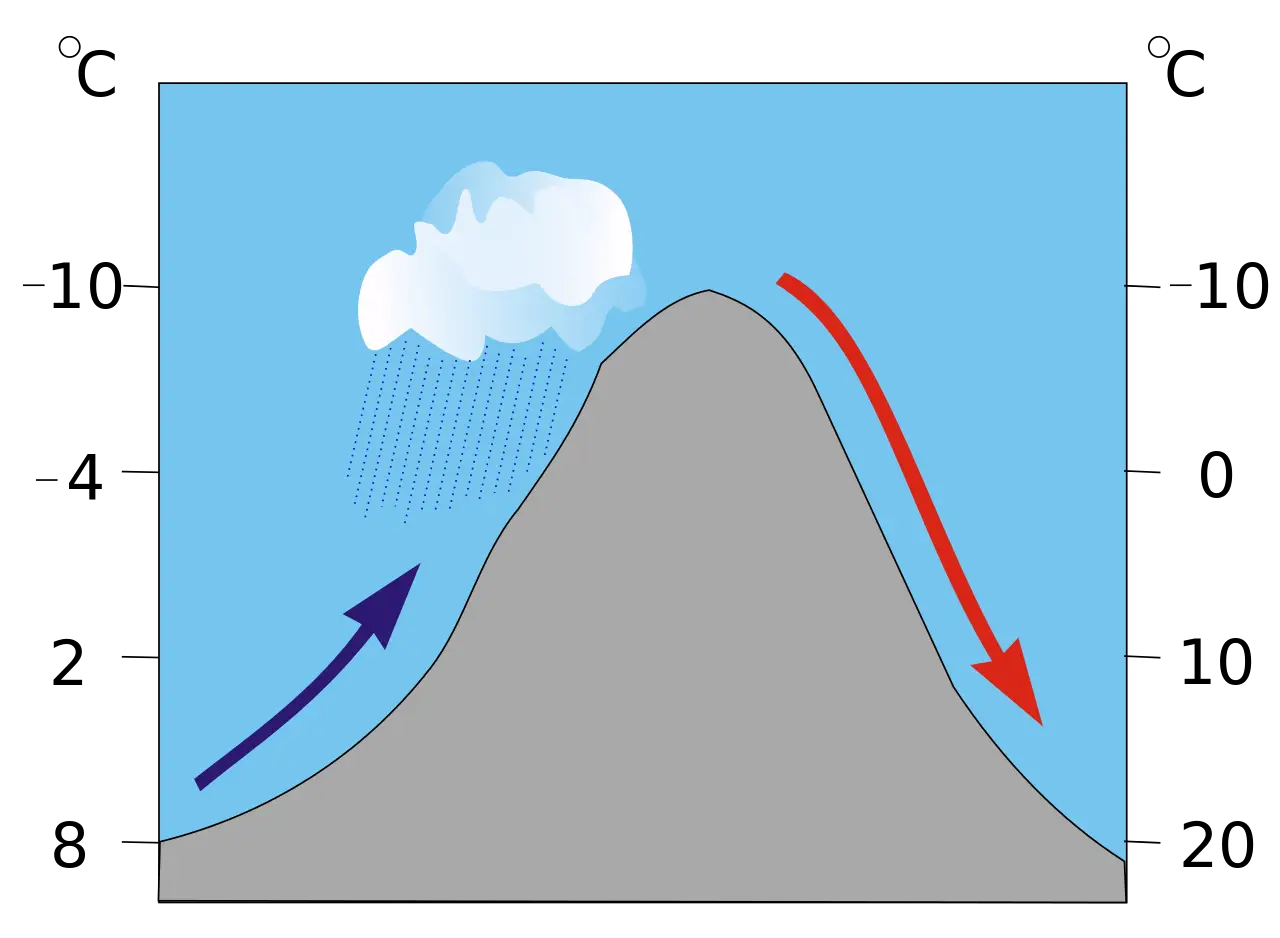
Weather Diagram with Temperature and Mountain -

Sun and Thermometer Weather Icon -
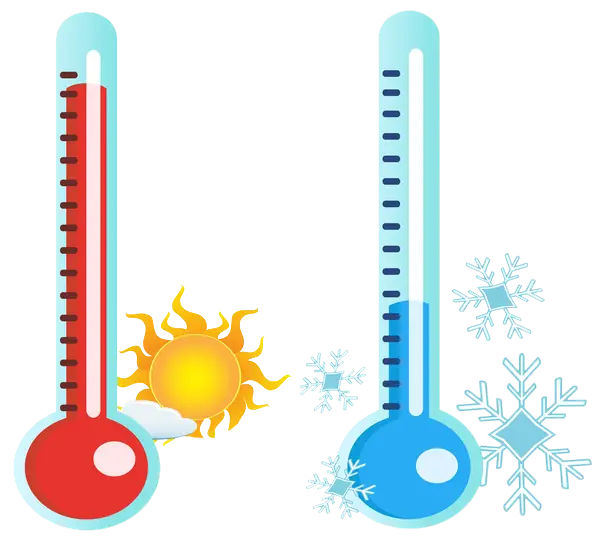
Thermometers Showing Hot and Cold Temperatures -

Thermometer with Temperature Lines Icon -
Red Thermometer Icon -
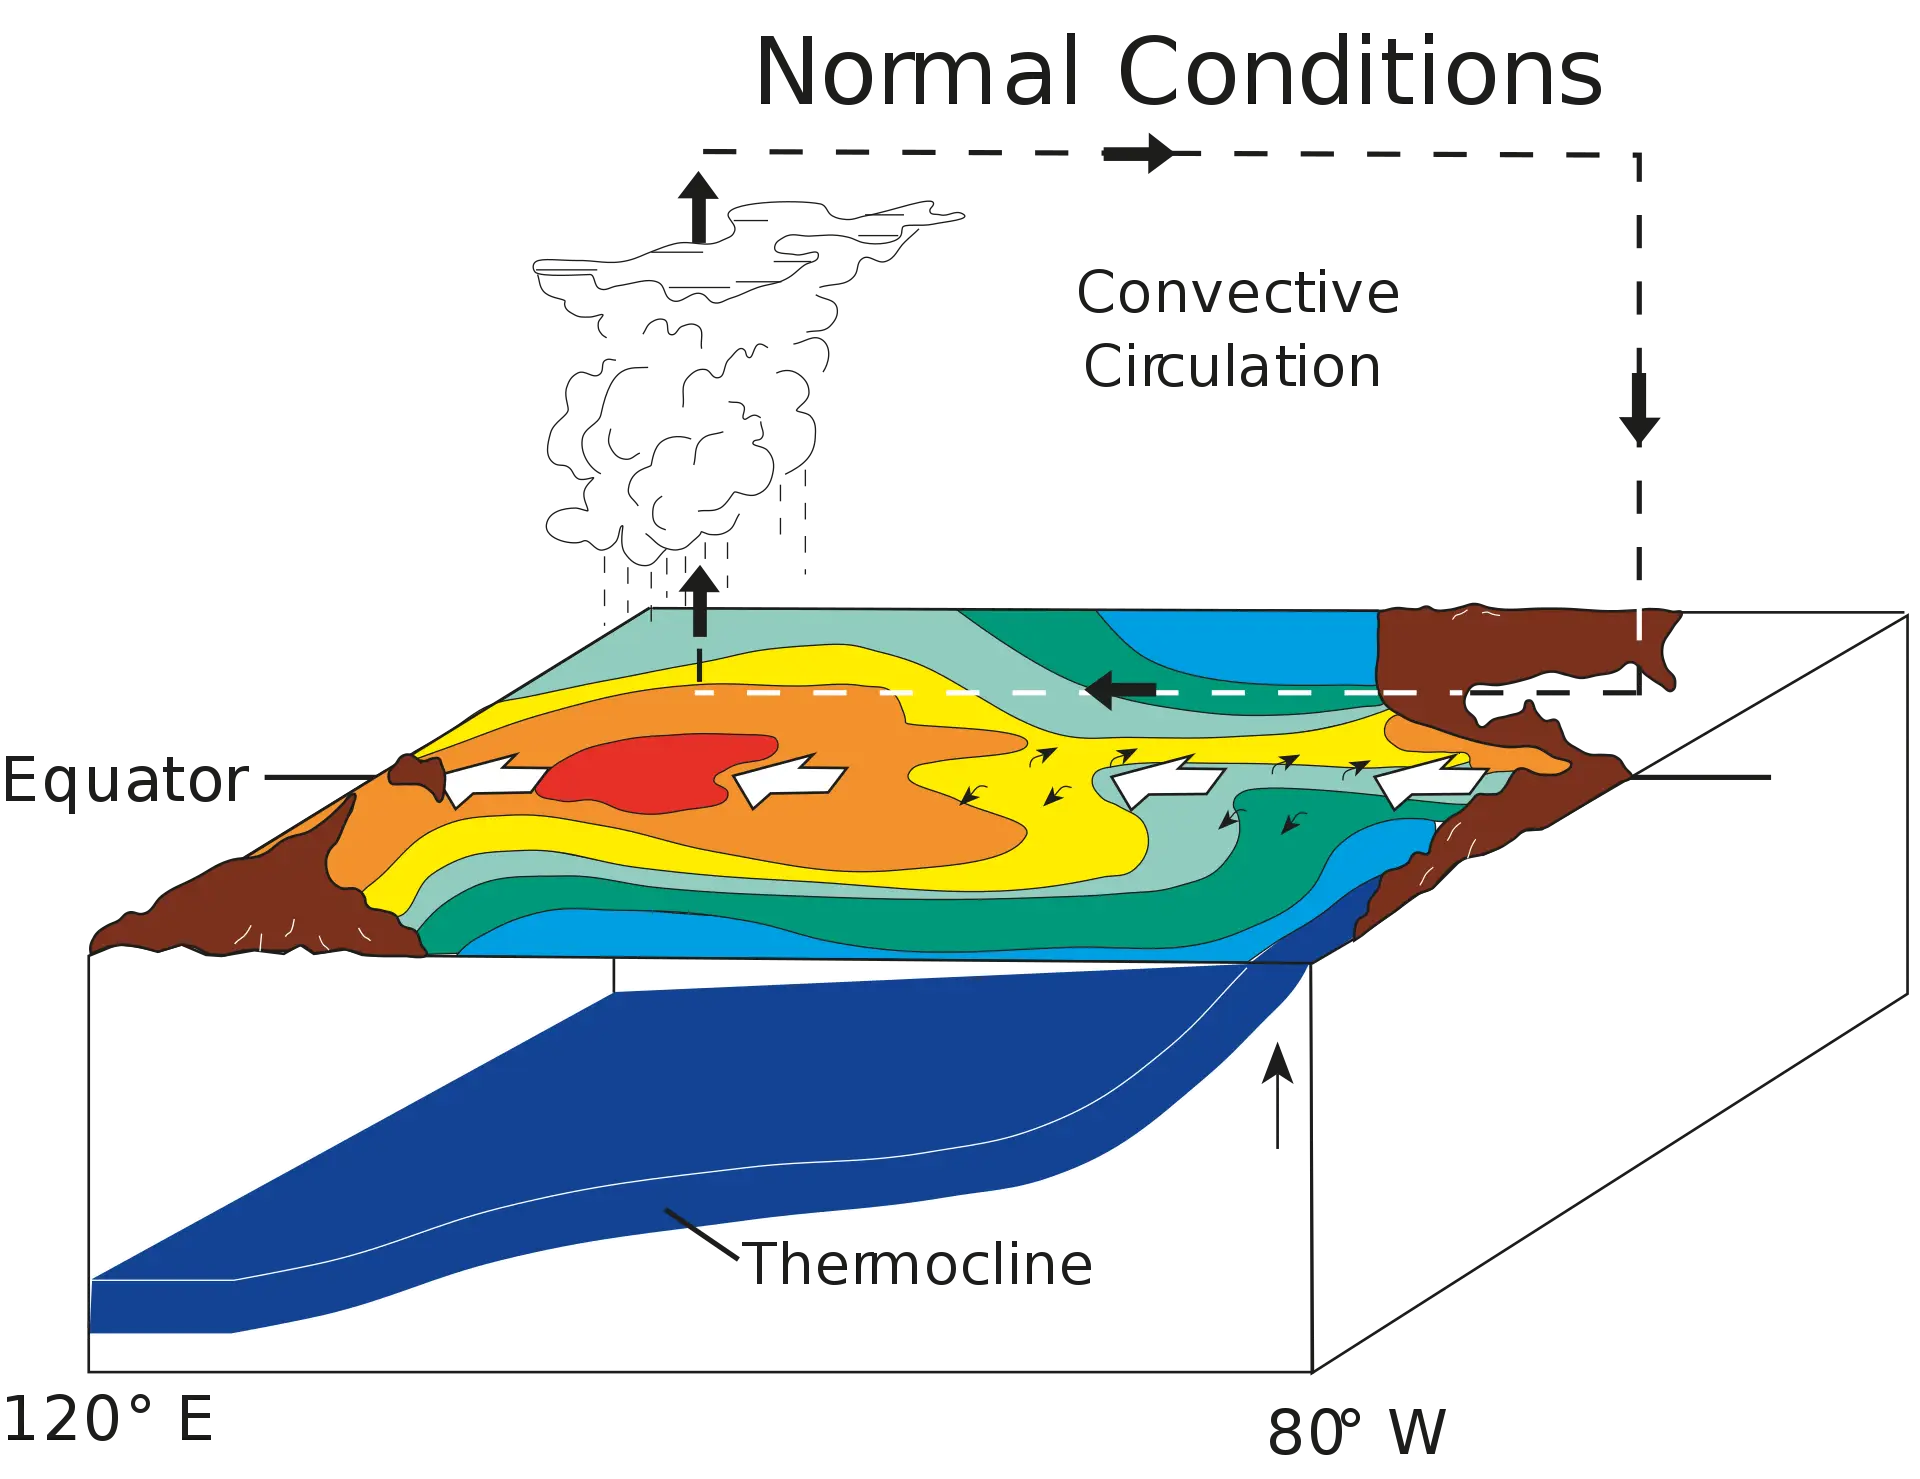
Illustrated Diagram of Weather Conditions -
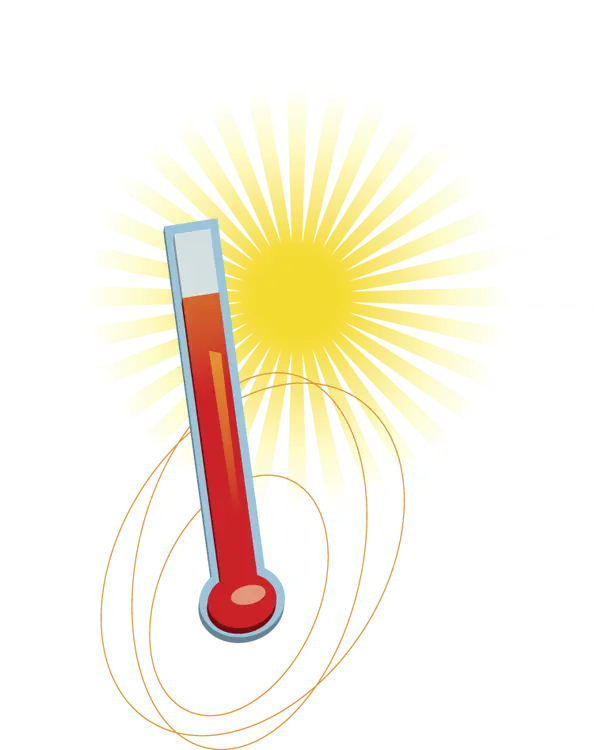
Hot Weather Thermometer -

White Fluffy Clouds in the Sky -

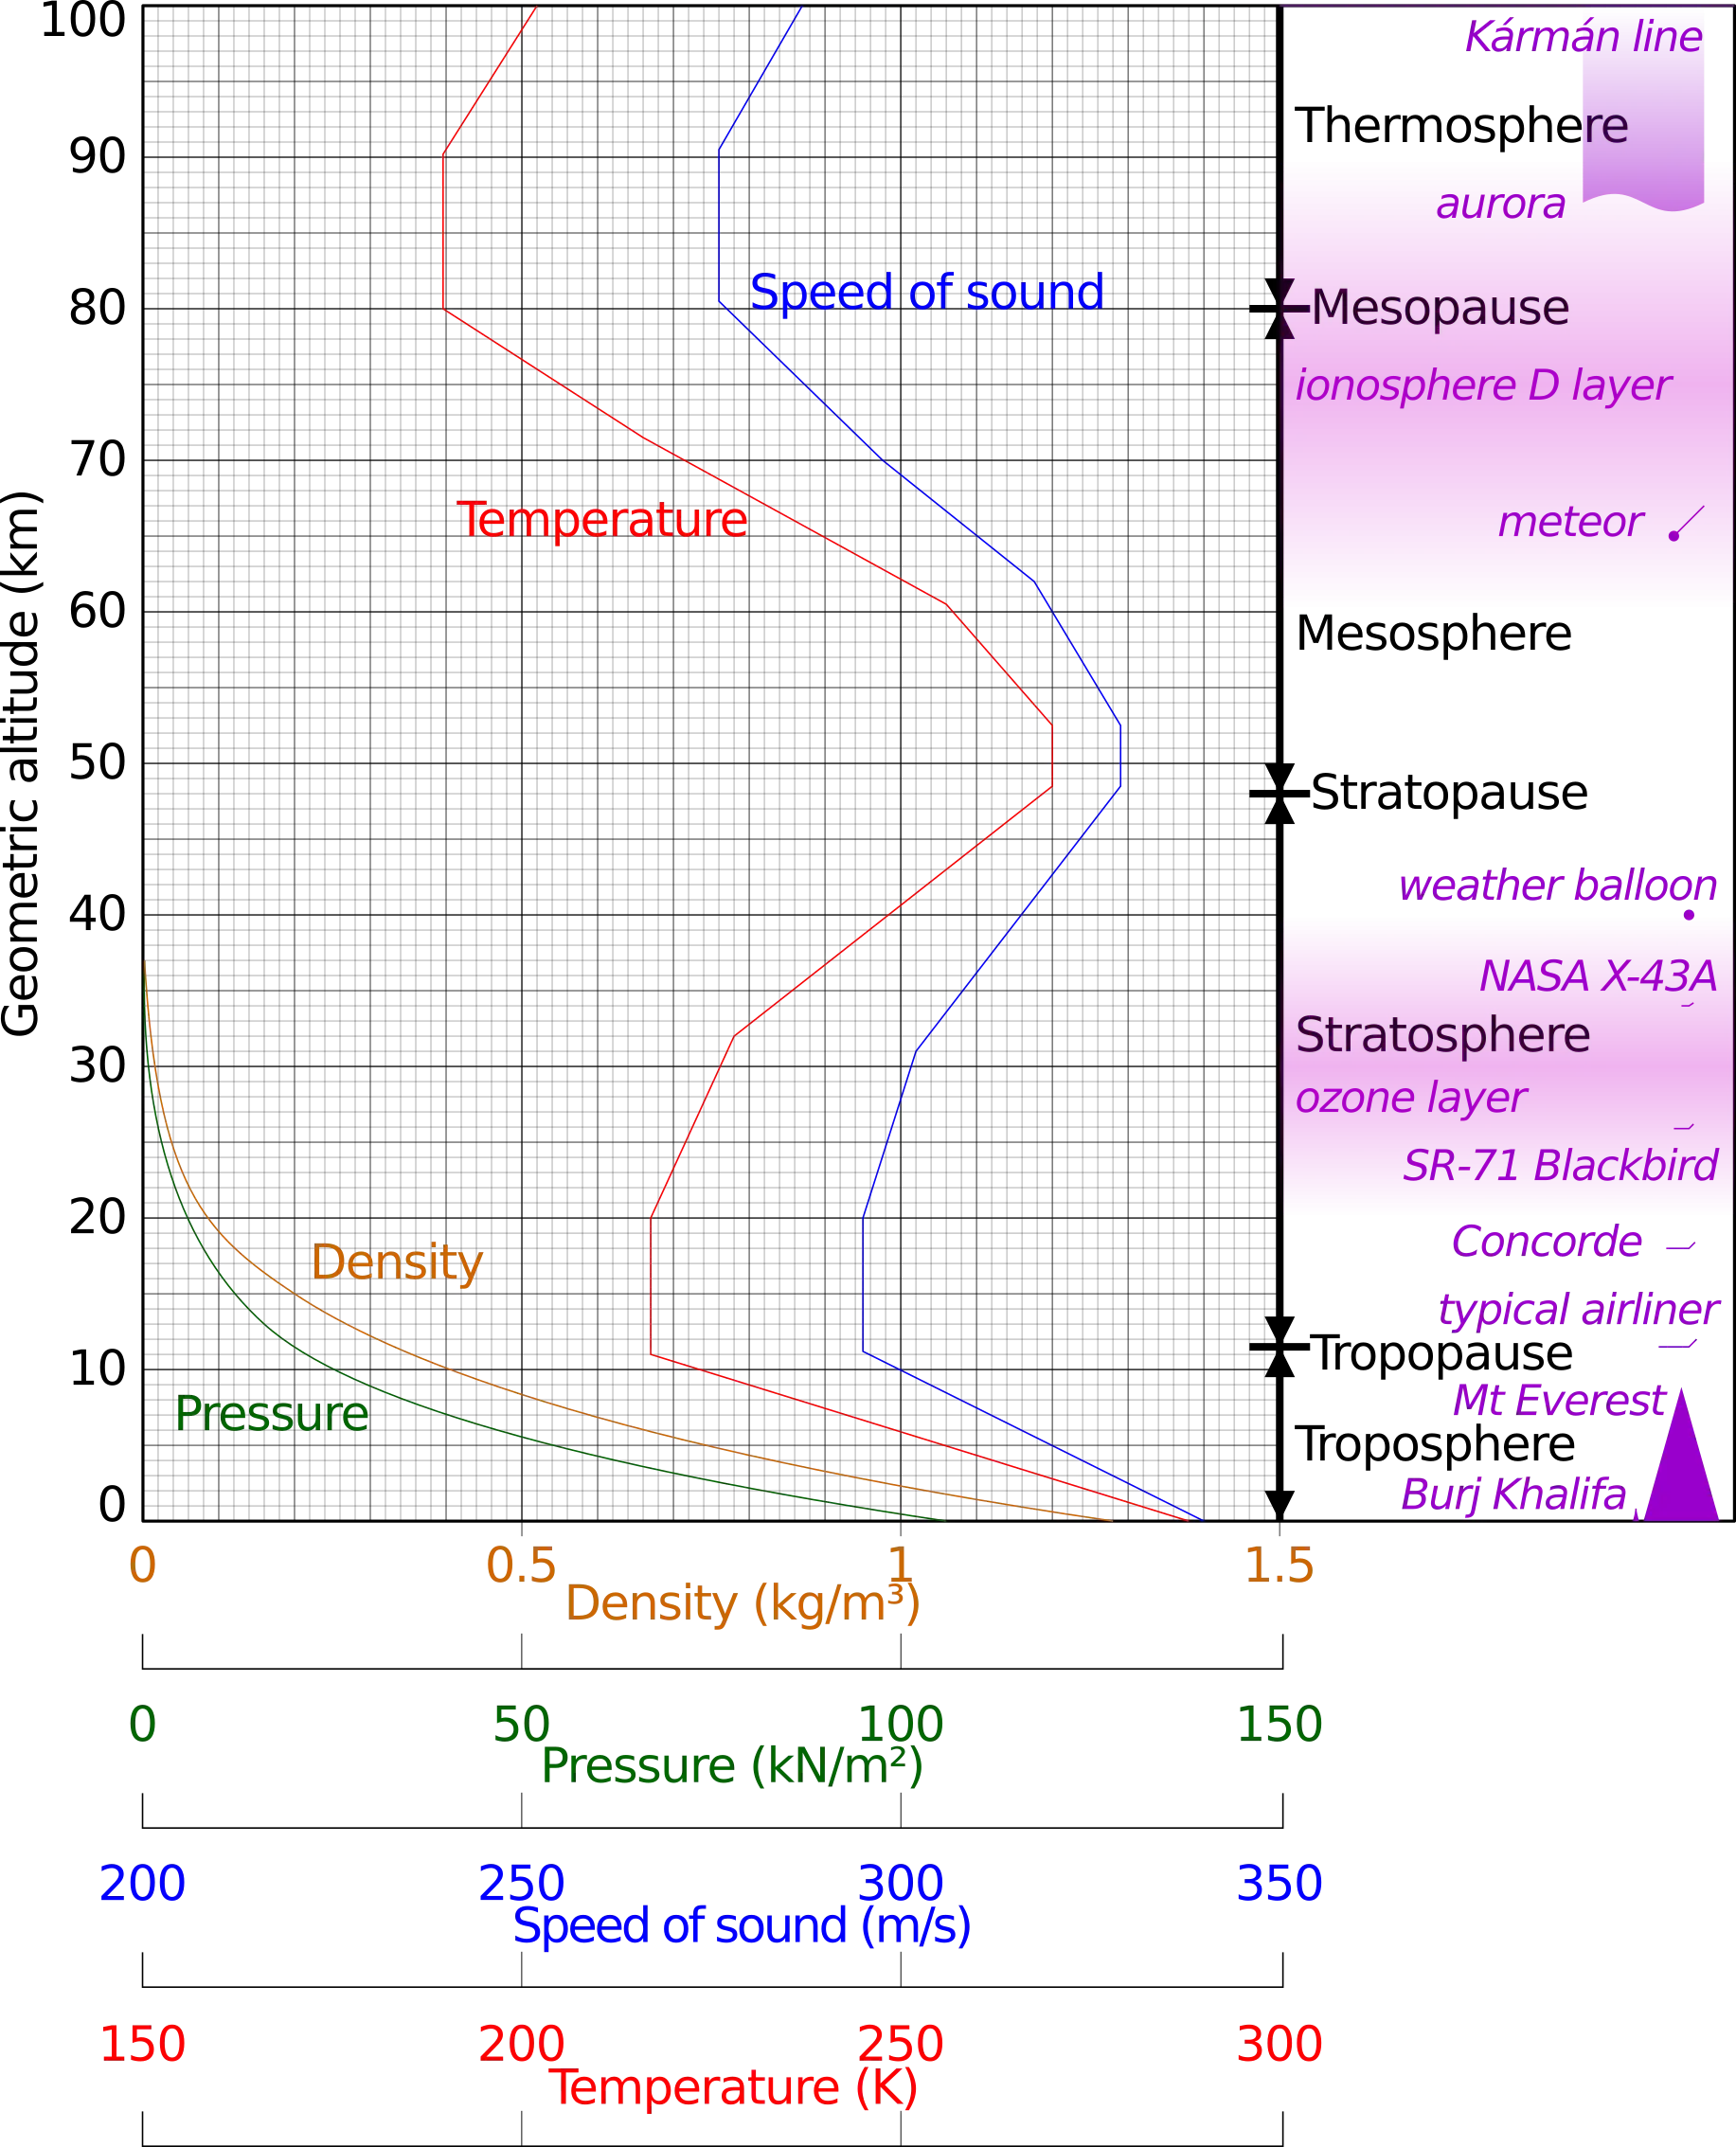
Half Planet with Atmospheric Texture -
Blue Electric Water Pump -
Thermometer Icon -
Blue Thermometer with Snowflake Icon -
Thermometer Showing High Temperature -

Hot Thermometer Cartoon Illustration