You Might Like
-

Intel Atom Logo -

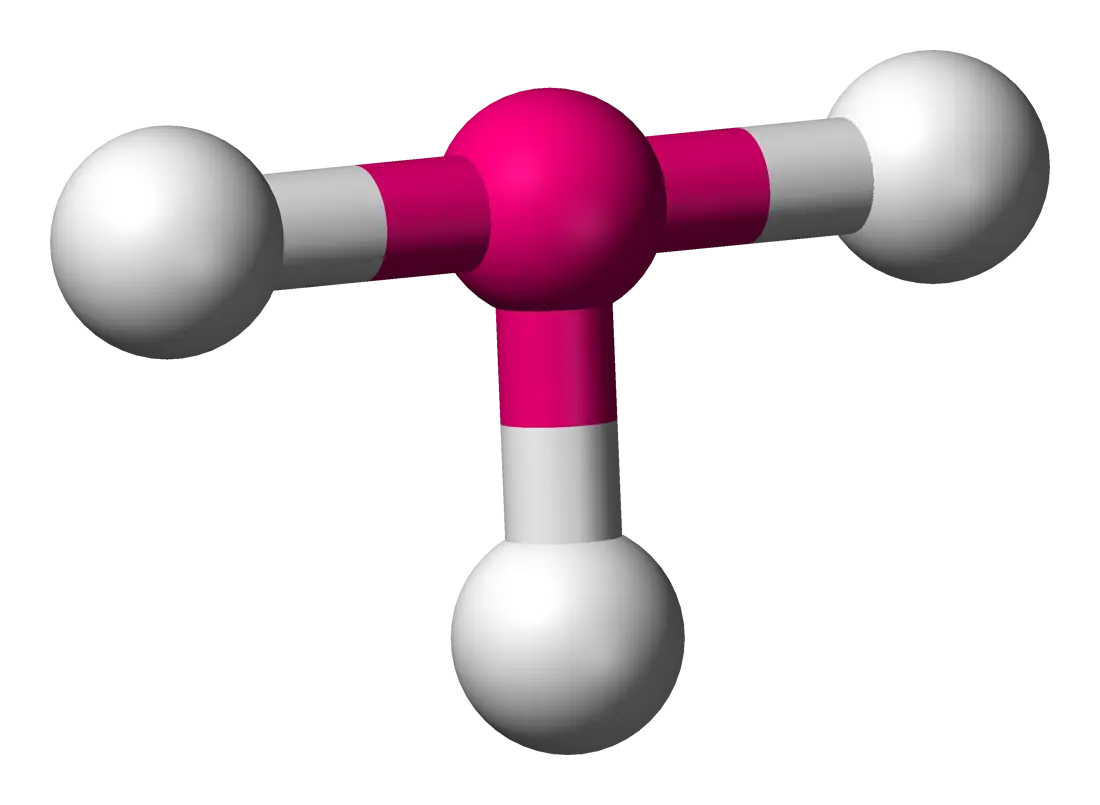
3D Blue and Gray Molecular Structure -

Red Atom Symbol for Science -

Atomic Symbol Icon Illustration -
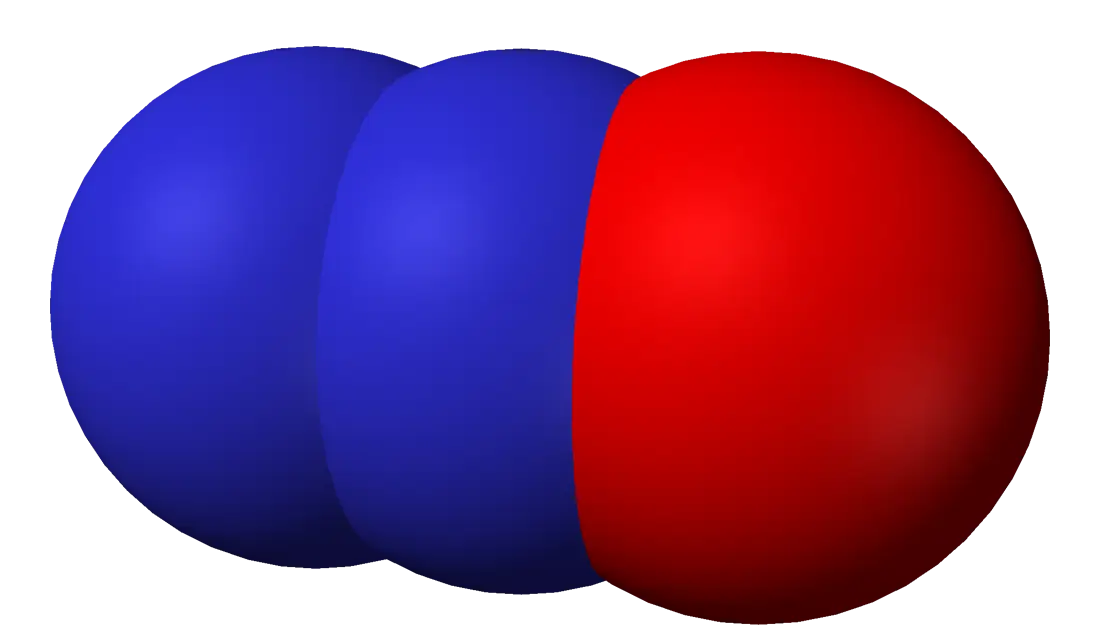
Molecule Structure Model -

Golden Atom Symbol Illustration -

Atomic Structure Symbol -
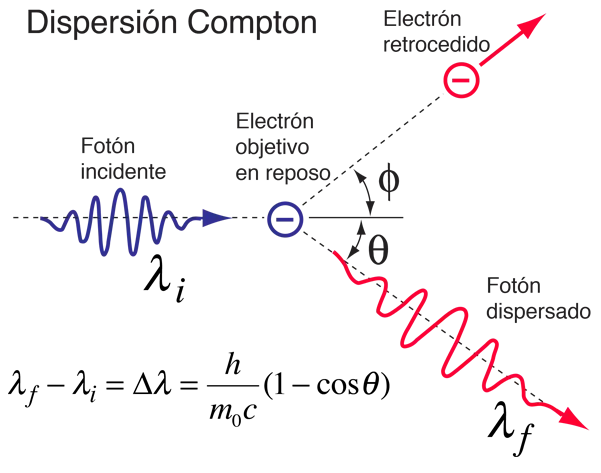
Compton Scattering Diagram in Physics -
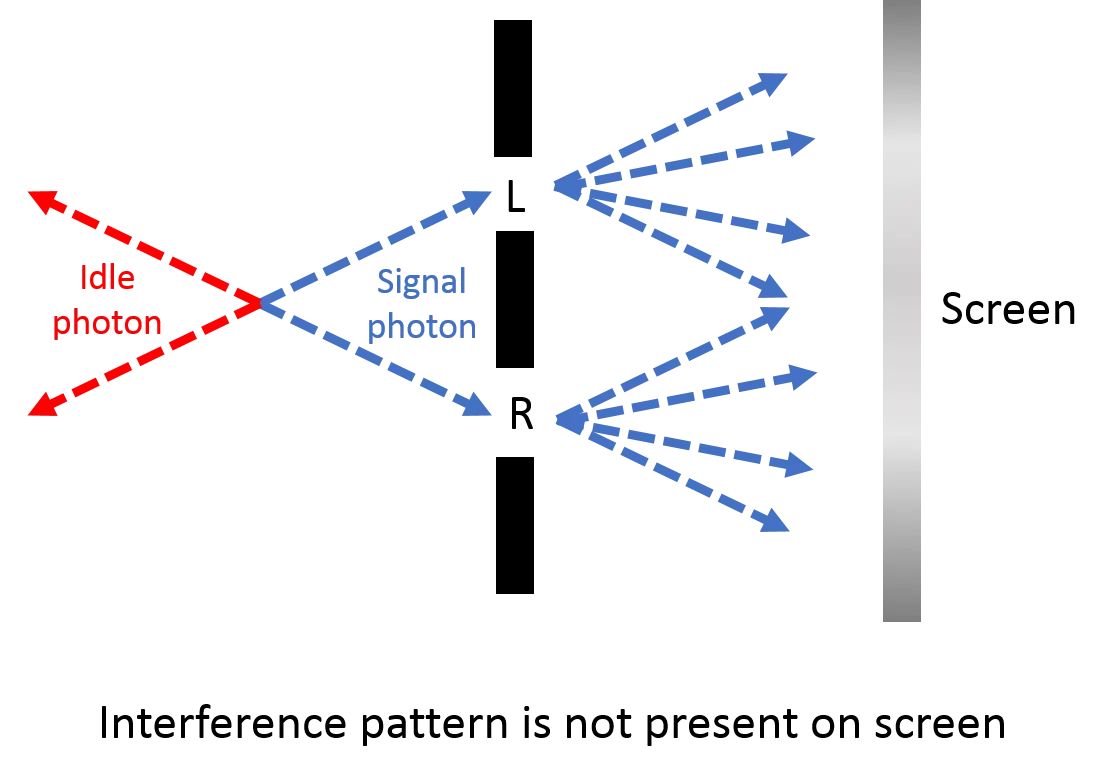
Photon Interference Pattern Diagram -

Engineering and Science Symbol -

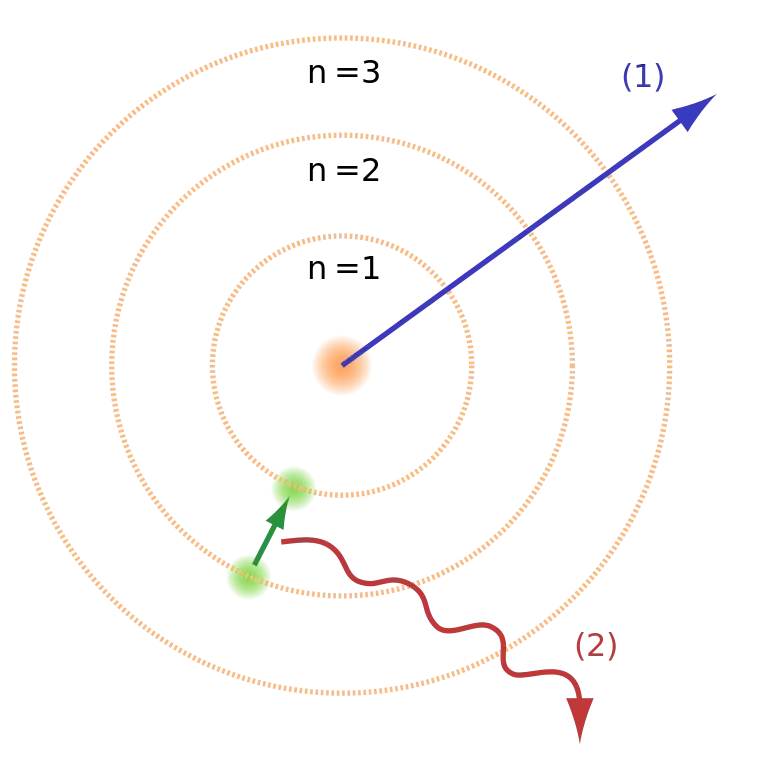
Atomic Structure Illustration with Colored Orbitals -

Atomic Structure Symbol for Science Illustration -
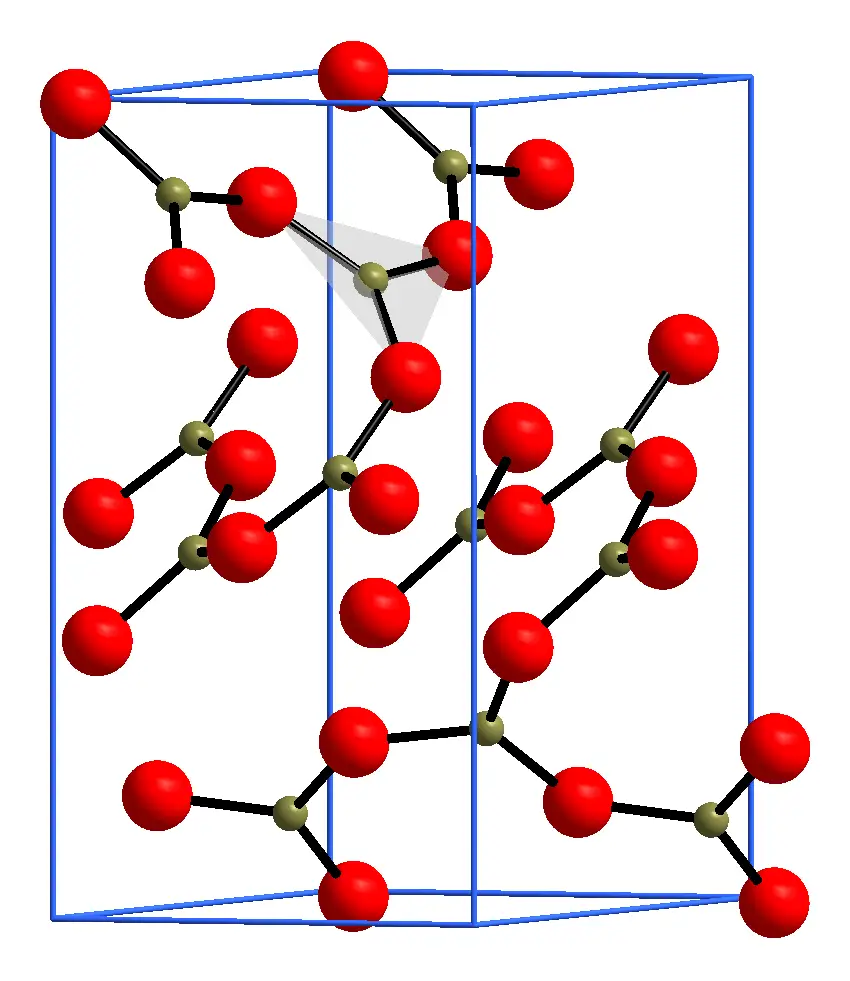
3D Unit Cell Lattice Structure Illustration -
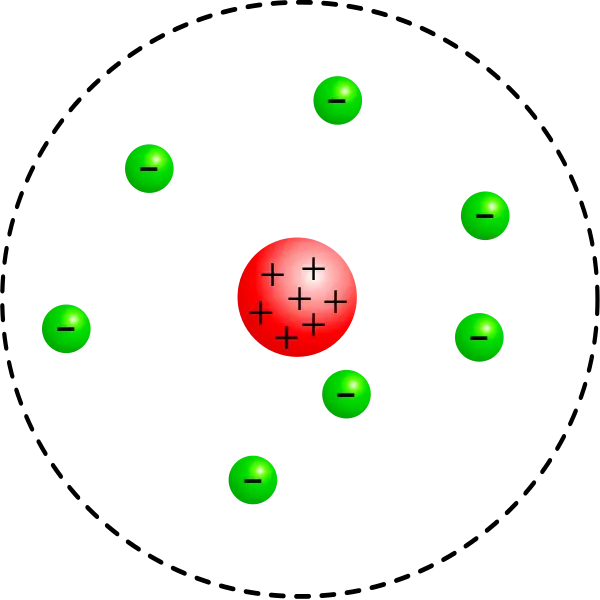
Simple Atom Model Diagram -

Black and White Atom Model Illustration -

Cute Science Cartoon with Beaker and Atom -

Science Beaker with Atom Symbol -

Atomic Structure Icon for Science Themes -

Atom Icon Representing Science and Chemistry -

Innovative Light Bulb with Atom -

Molecular Structure Featuring Bromine Atom Chemistry Model -
Molecule Representation for Scientific Education -

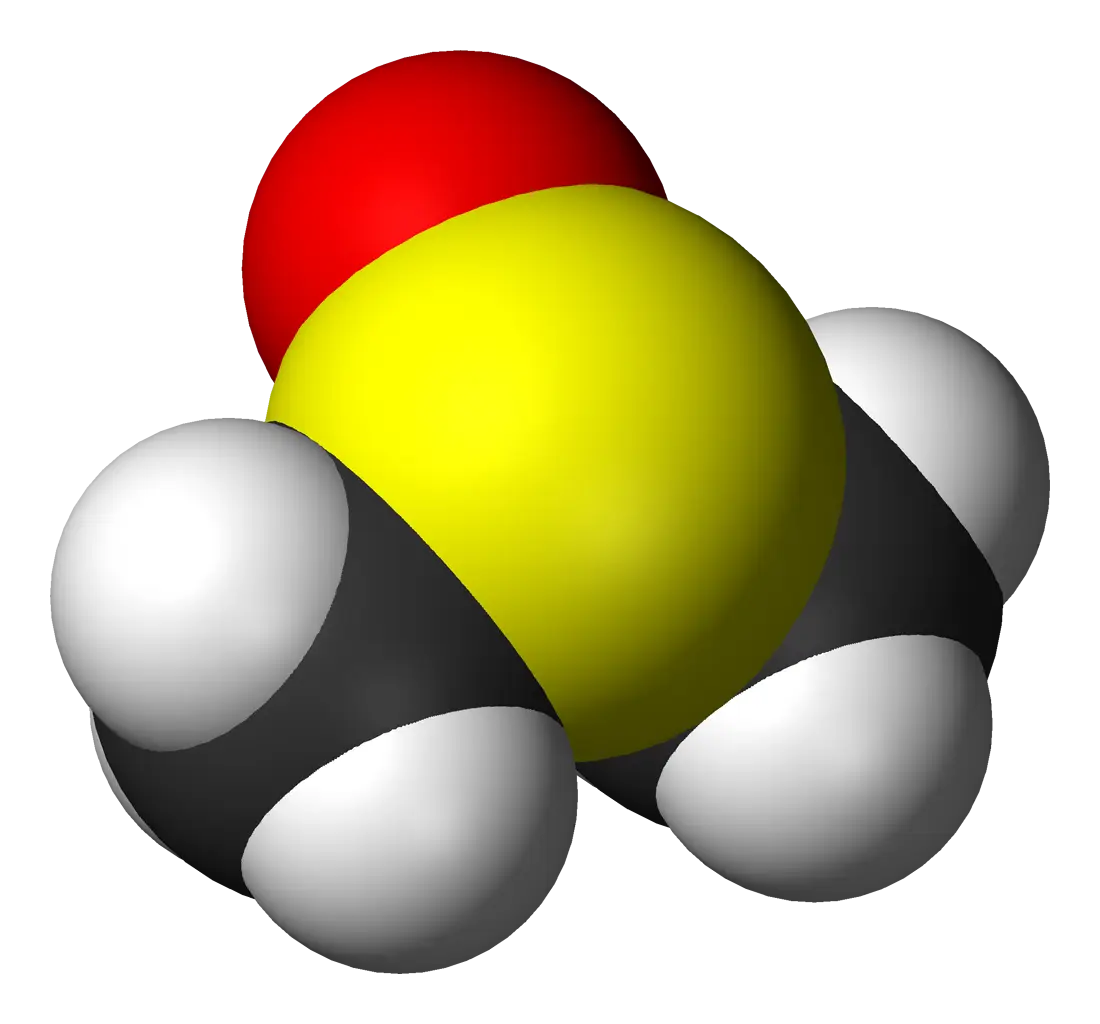
Detailed Molecular Structure Diagram -

Atomic Symbol with Electron Orbit Lines -

Blue Science Book -
Chemical Molecule Model Representation -
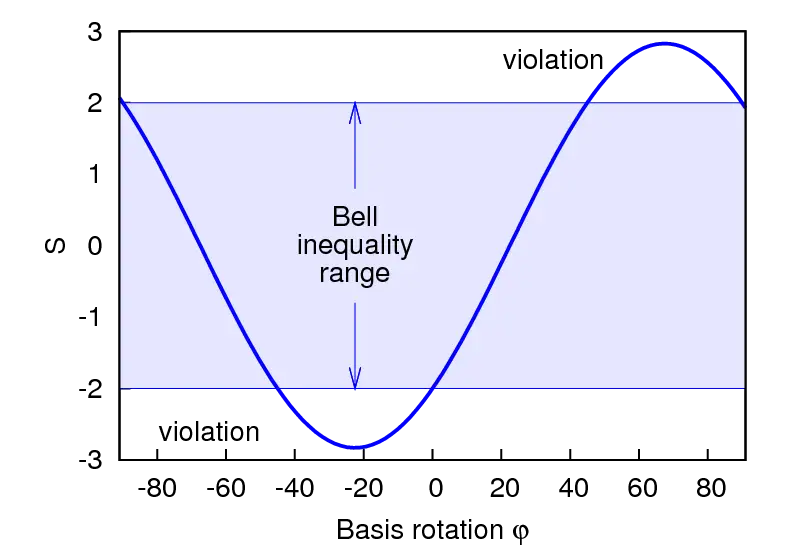
Bell Inequality Violation Graph -

Black Atom Symbol Illustration -

Orange Molecule Icon for Science Concept -

Visa Electron Logo