
Market Price Graph Showing Quarterly Trends
Observe a straightforward line graph charting market price movements over several quarters. The clear grid backdrop helps in tracking the upward trajectory of prices, revealing periods of steady growth punctuated by more significant increases. It's a useful visualization for understanding how market values evolve through different quarterly cycles.
market price - quarterly trends - line graph - financial data - price analysis - economic growth
This image only for personal use, png & jpg filesize may vary
You Might Like
-
Dollar Symbol with Magnifying Glass Icon -
Line Graph Showing a Rising Data Trend -
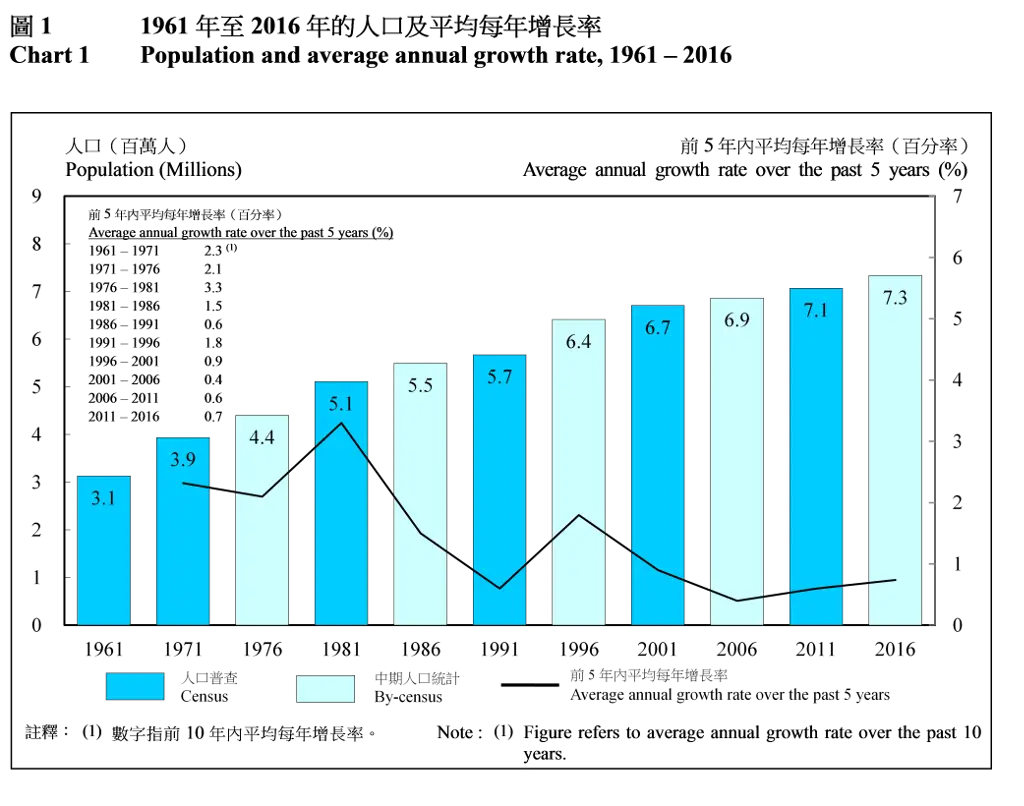
Population and Average Annual Growth Rate Chart -
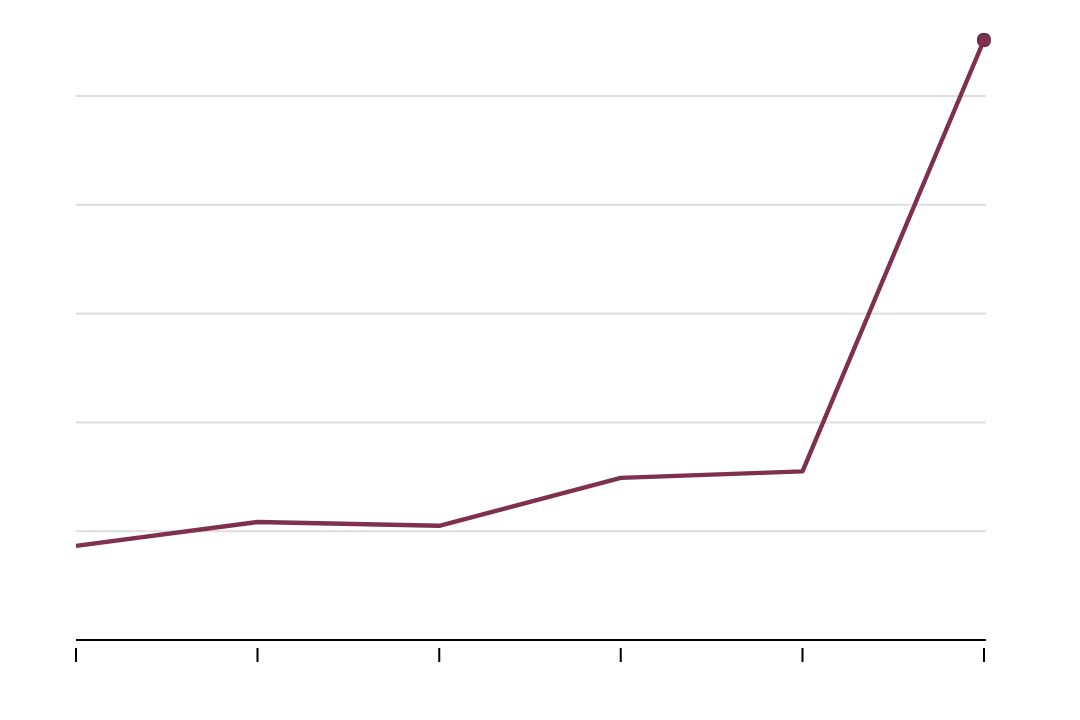
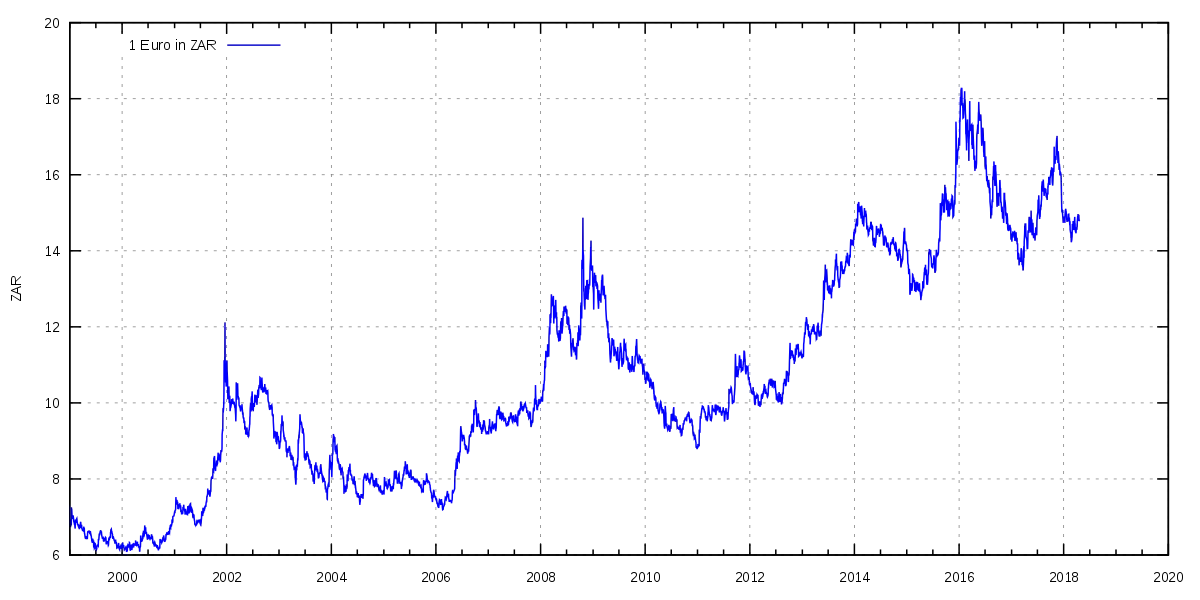
Line Graph with Data Points and Trends -
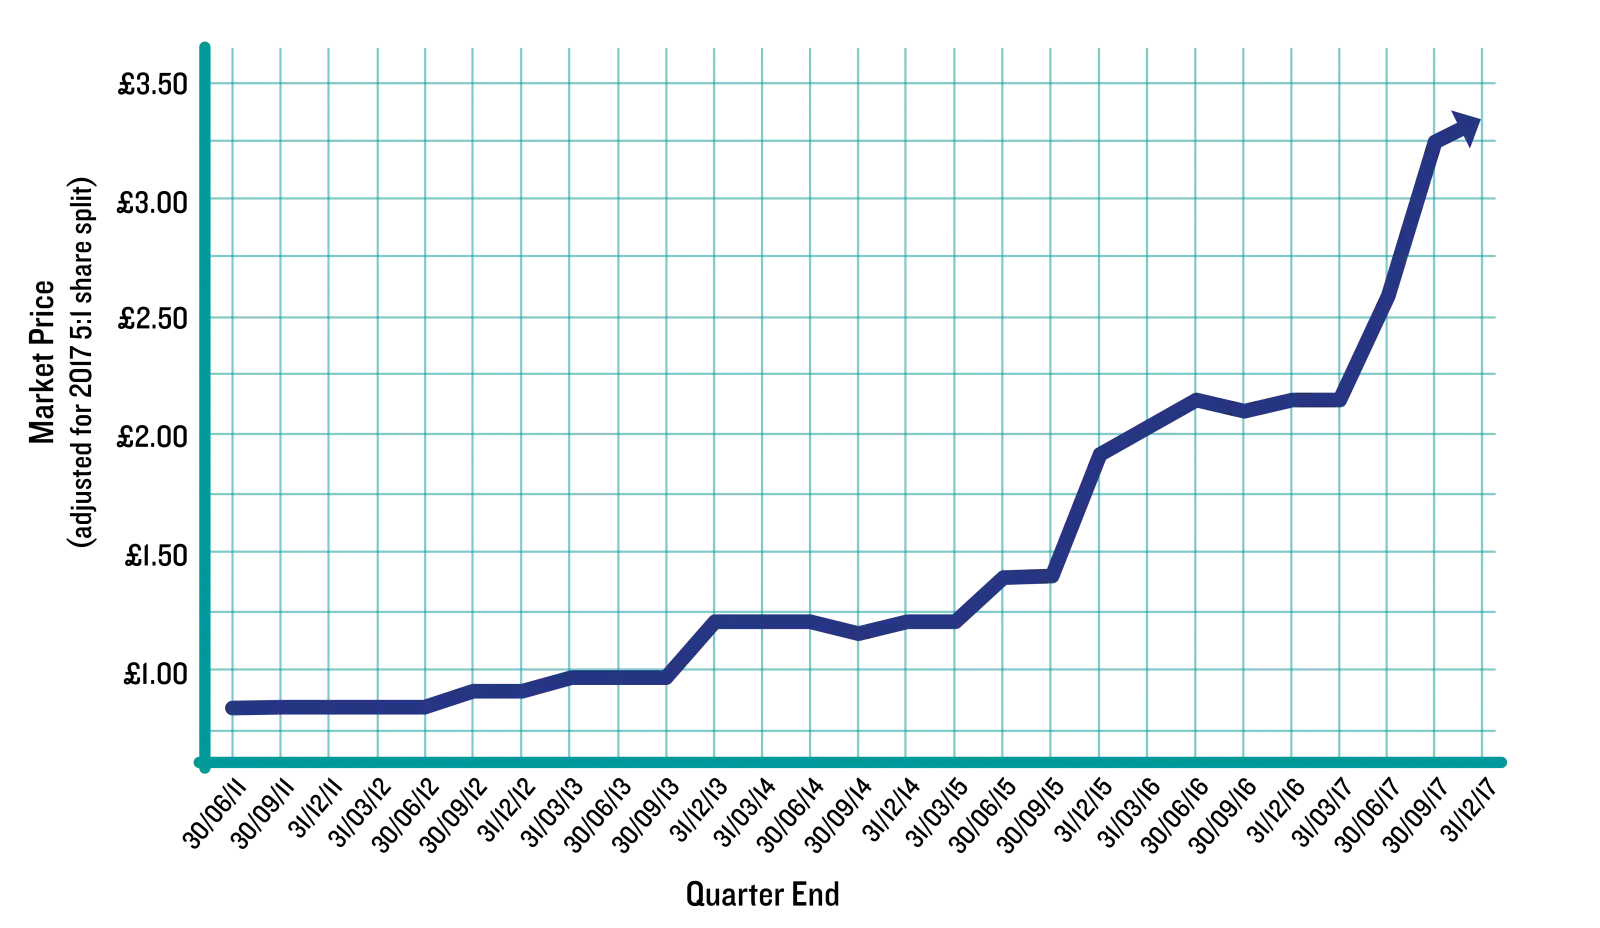
Teal Upward Arrow on Line Chart -
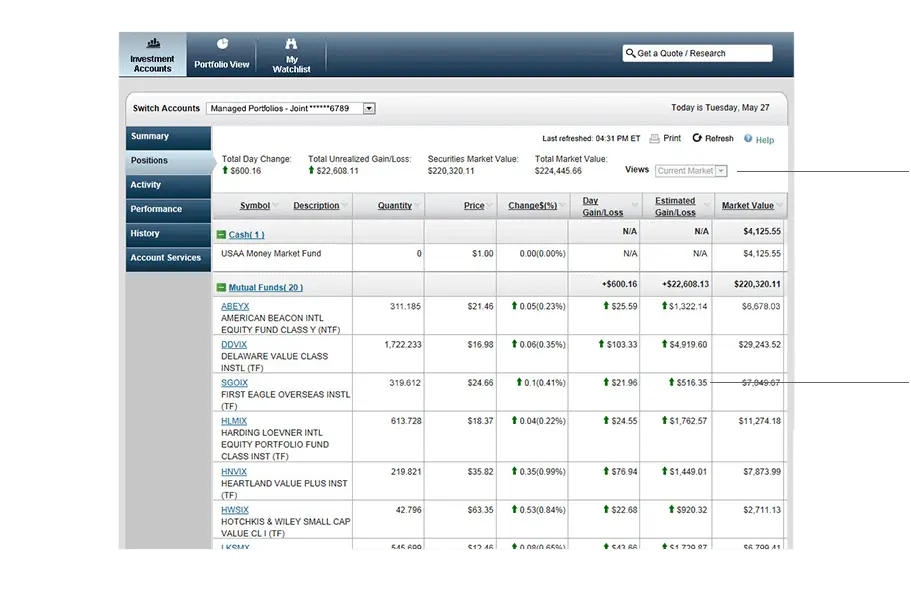
Investment Portfolio Summary -
Data Analysis Graph with Trend Lines -
Blue Linear Graph Showing Statistical Trend -
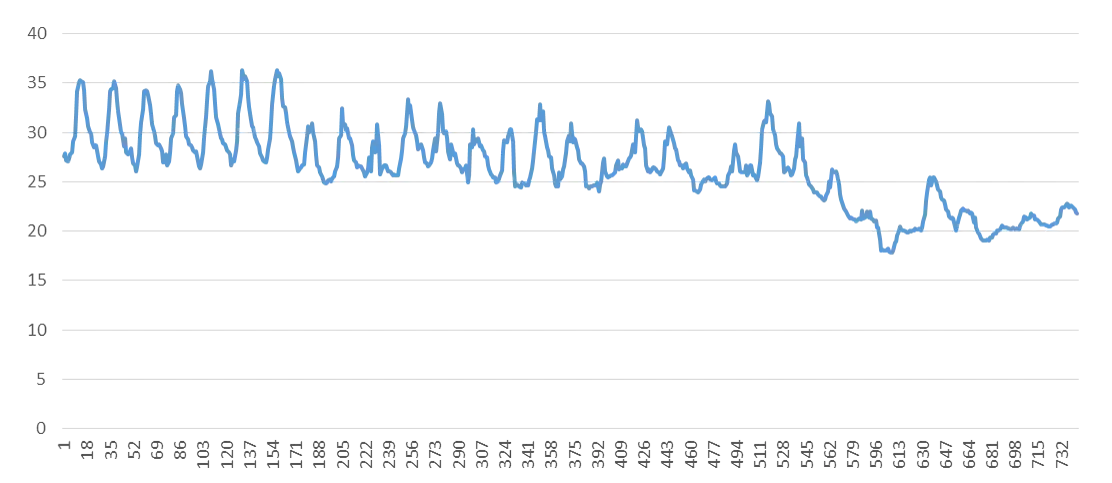
Line Graph Showing Data Trends Over Time