
The Power of Dividends and Compounding Chart
This chart powerfully illustrates the long-term benefits of investing, clearly showing how an initial investment (represented by the dark area) grows steadily over time. What truly stands out is the significant boost provided by reinvested dividends and the compounding effect, highlighted by the bright blue area. It's a compelling visual demonstration of how consistent investment, combined with the snowball effect of compounding returns, can lead to substantial wealth accumulation over the years.
investing - dividends - compounding - financial growth - wealth building - stock market
This image only for personal use, png & jpg filesize may vary
You Might Like
-
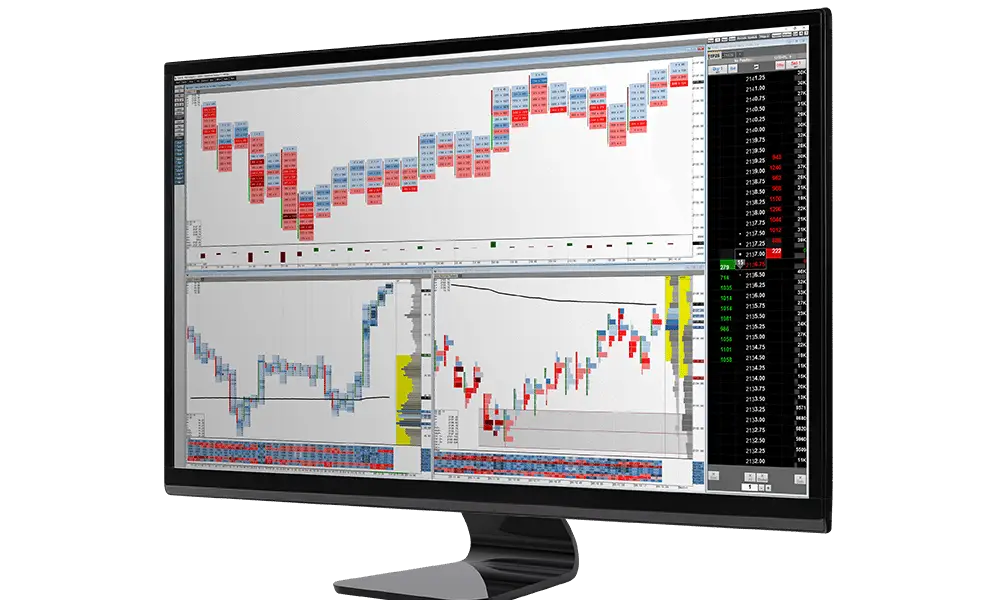
Trading Monitor with Financial Data Display -
Bear and Bull Silhouette in Stock Market -
Money Plant in Jar Symbolizing Growth -
Teamwork Illustration for Business Success -
Piggy bank and investment growth concept -
Jar of Coins for Savings Concept -
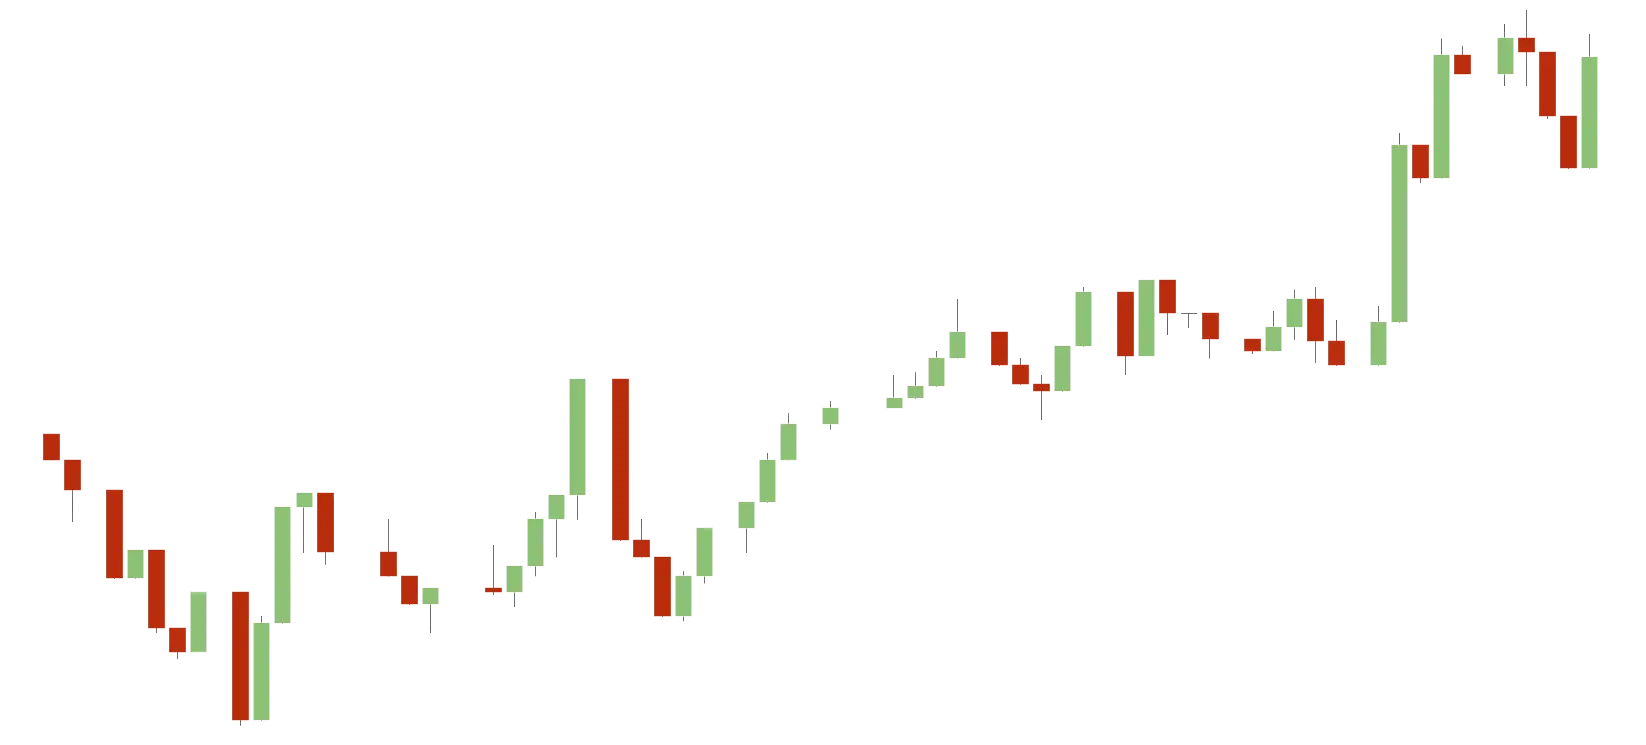
Stock Market Candlestick Chart for Analysis -
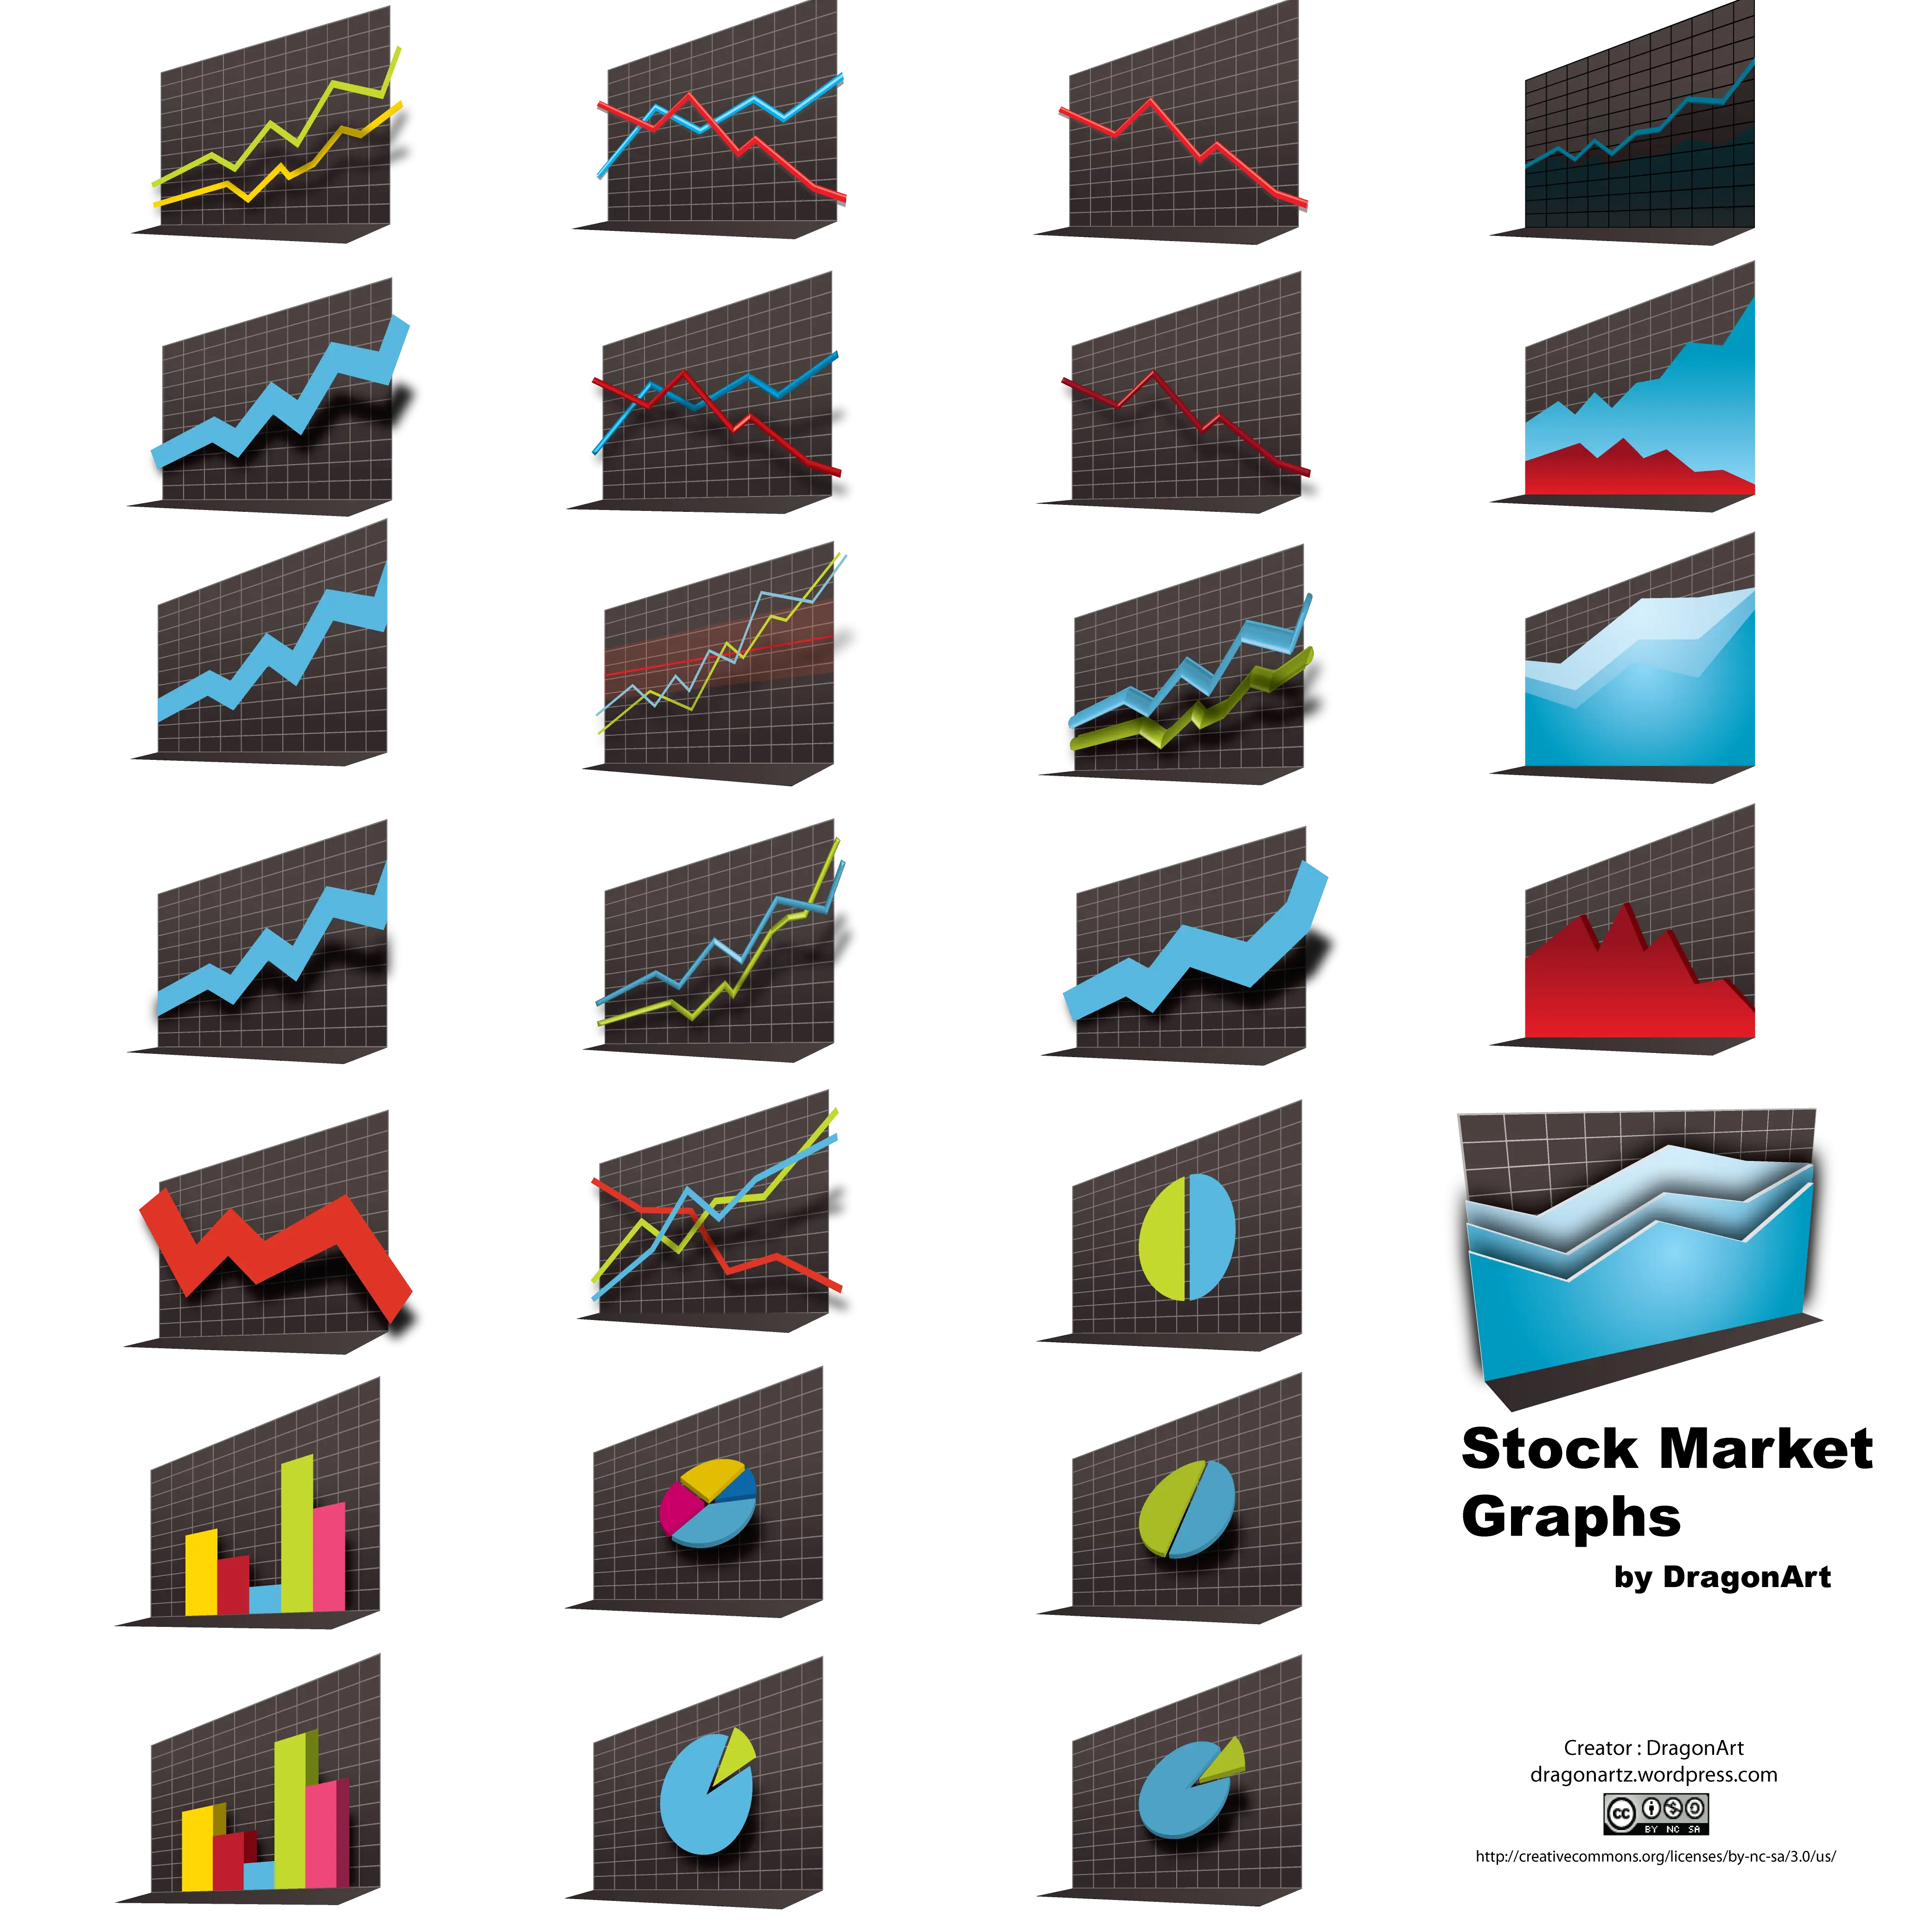
Stock Market Graphs Collection -
Red Candlestick Chart for Stock Analysis -
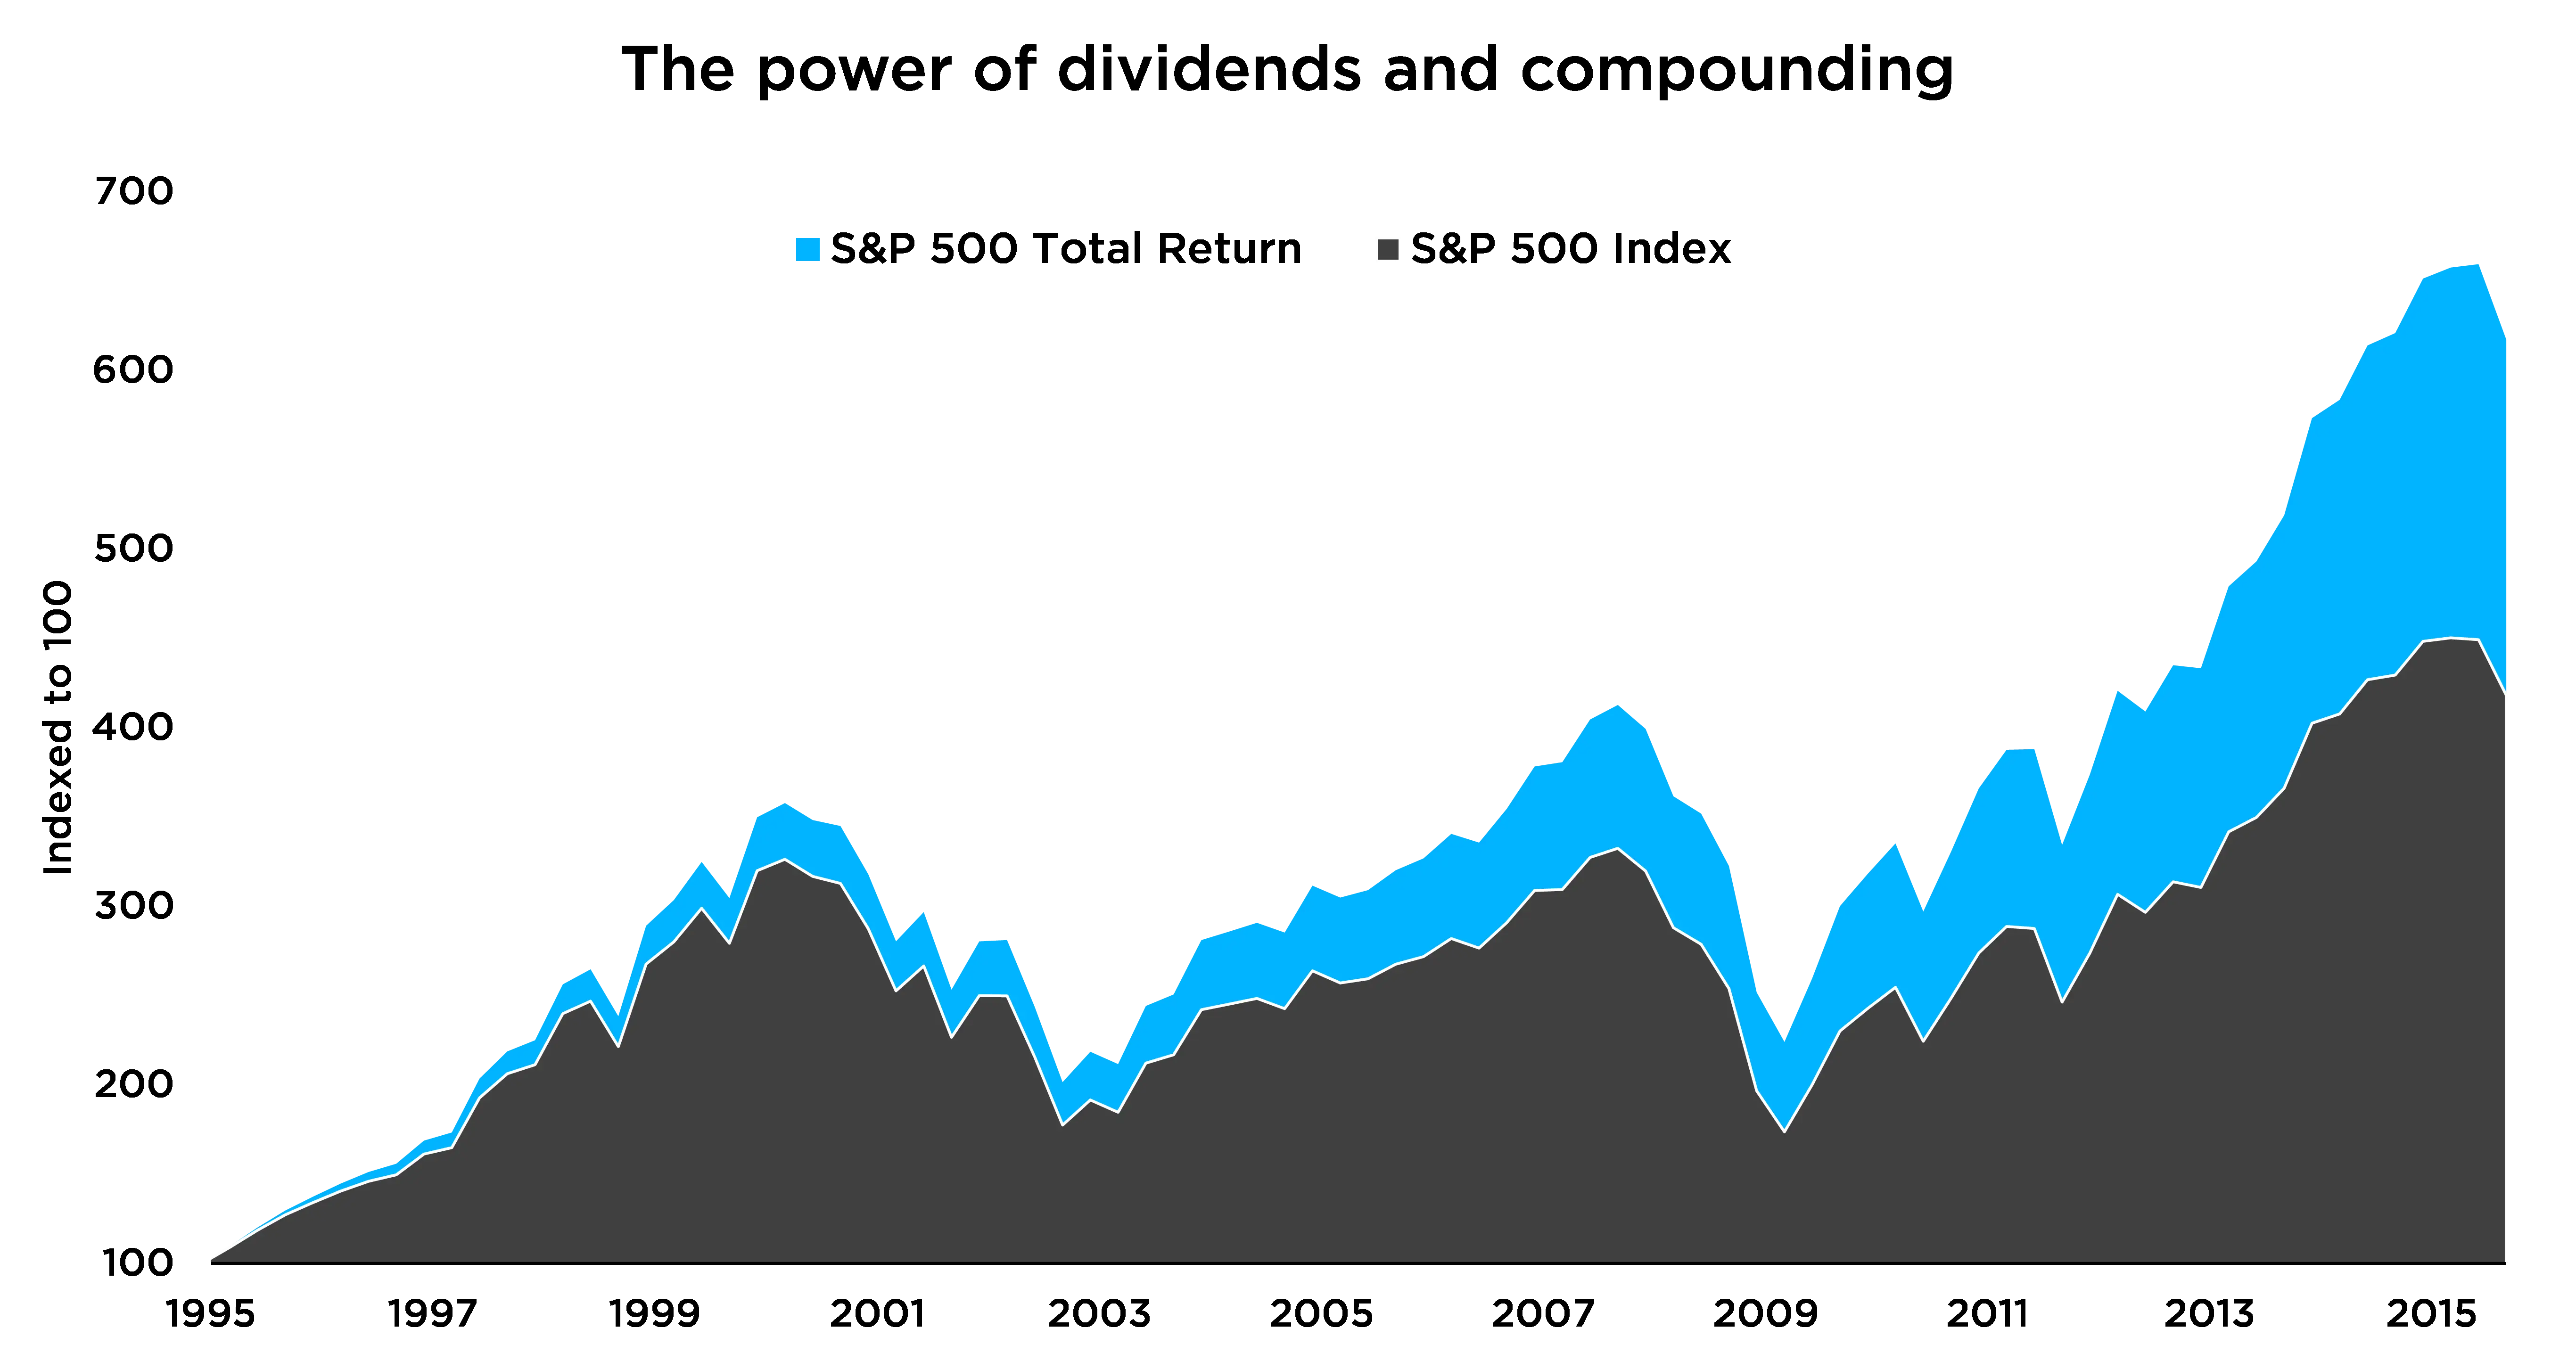
Wealth Accumulation Over Time -
Stock Market Chart Showing Historical Trends -
Money Growth Icon for Financial Success -
Stock Market Trading Chart