You Might Like
-
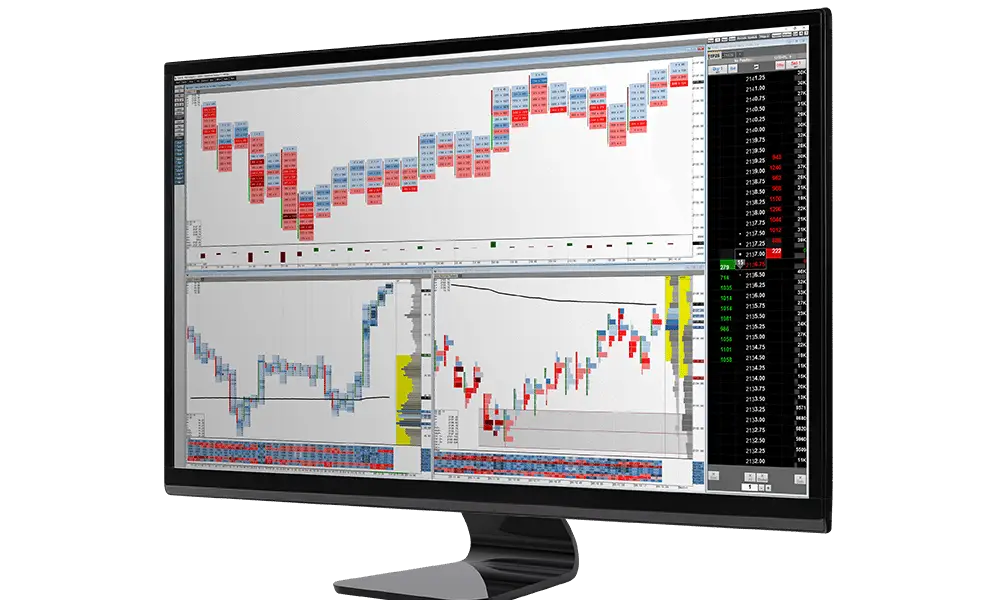
Trading Monitor with Financial Data Display -

Bear and Bull Silhouette in Stock Market -
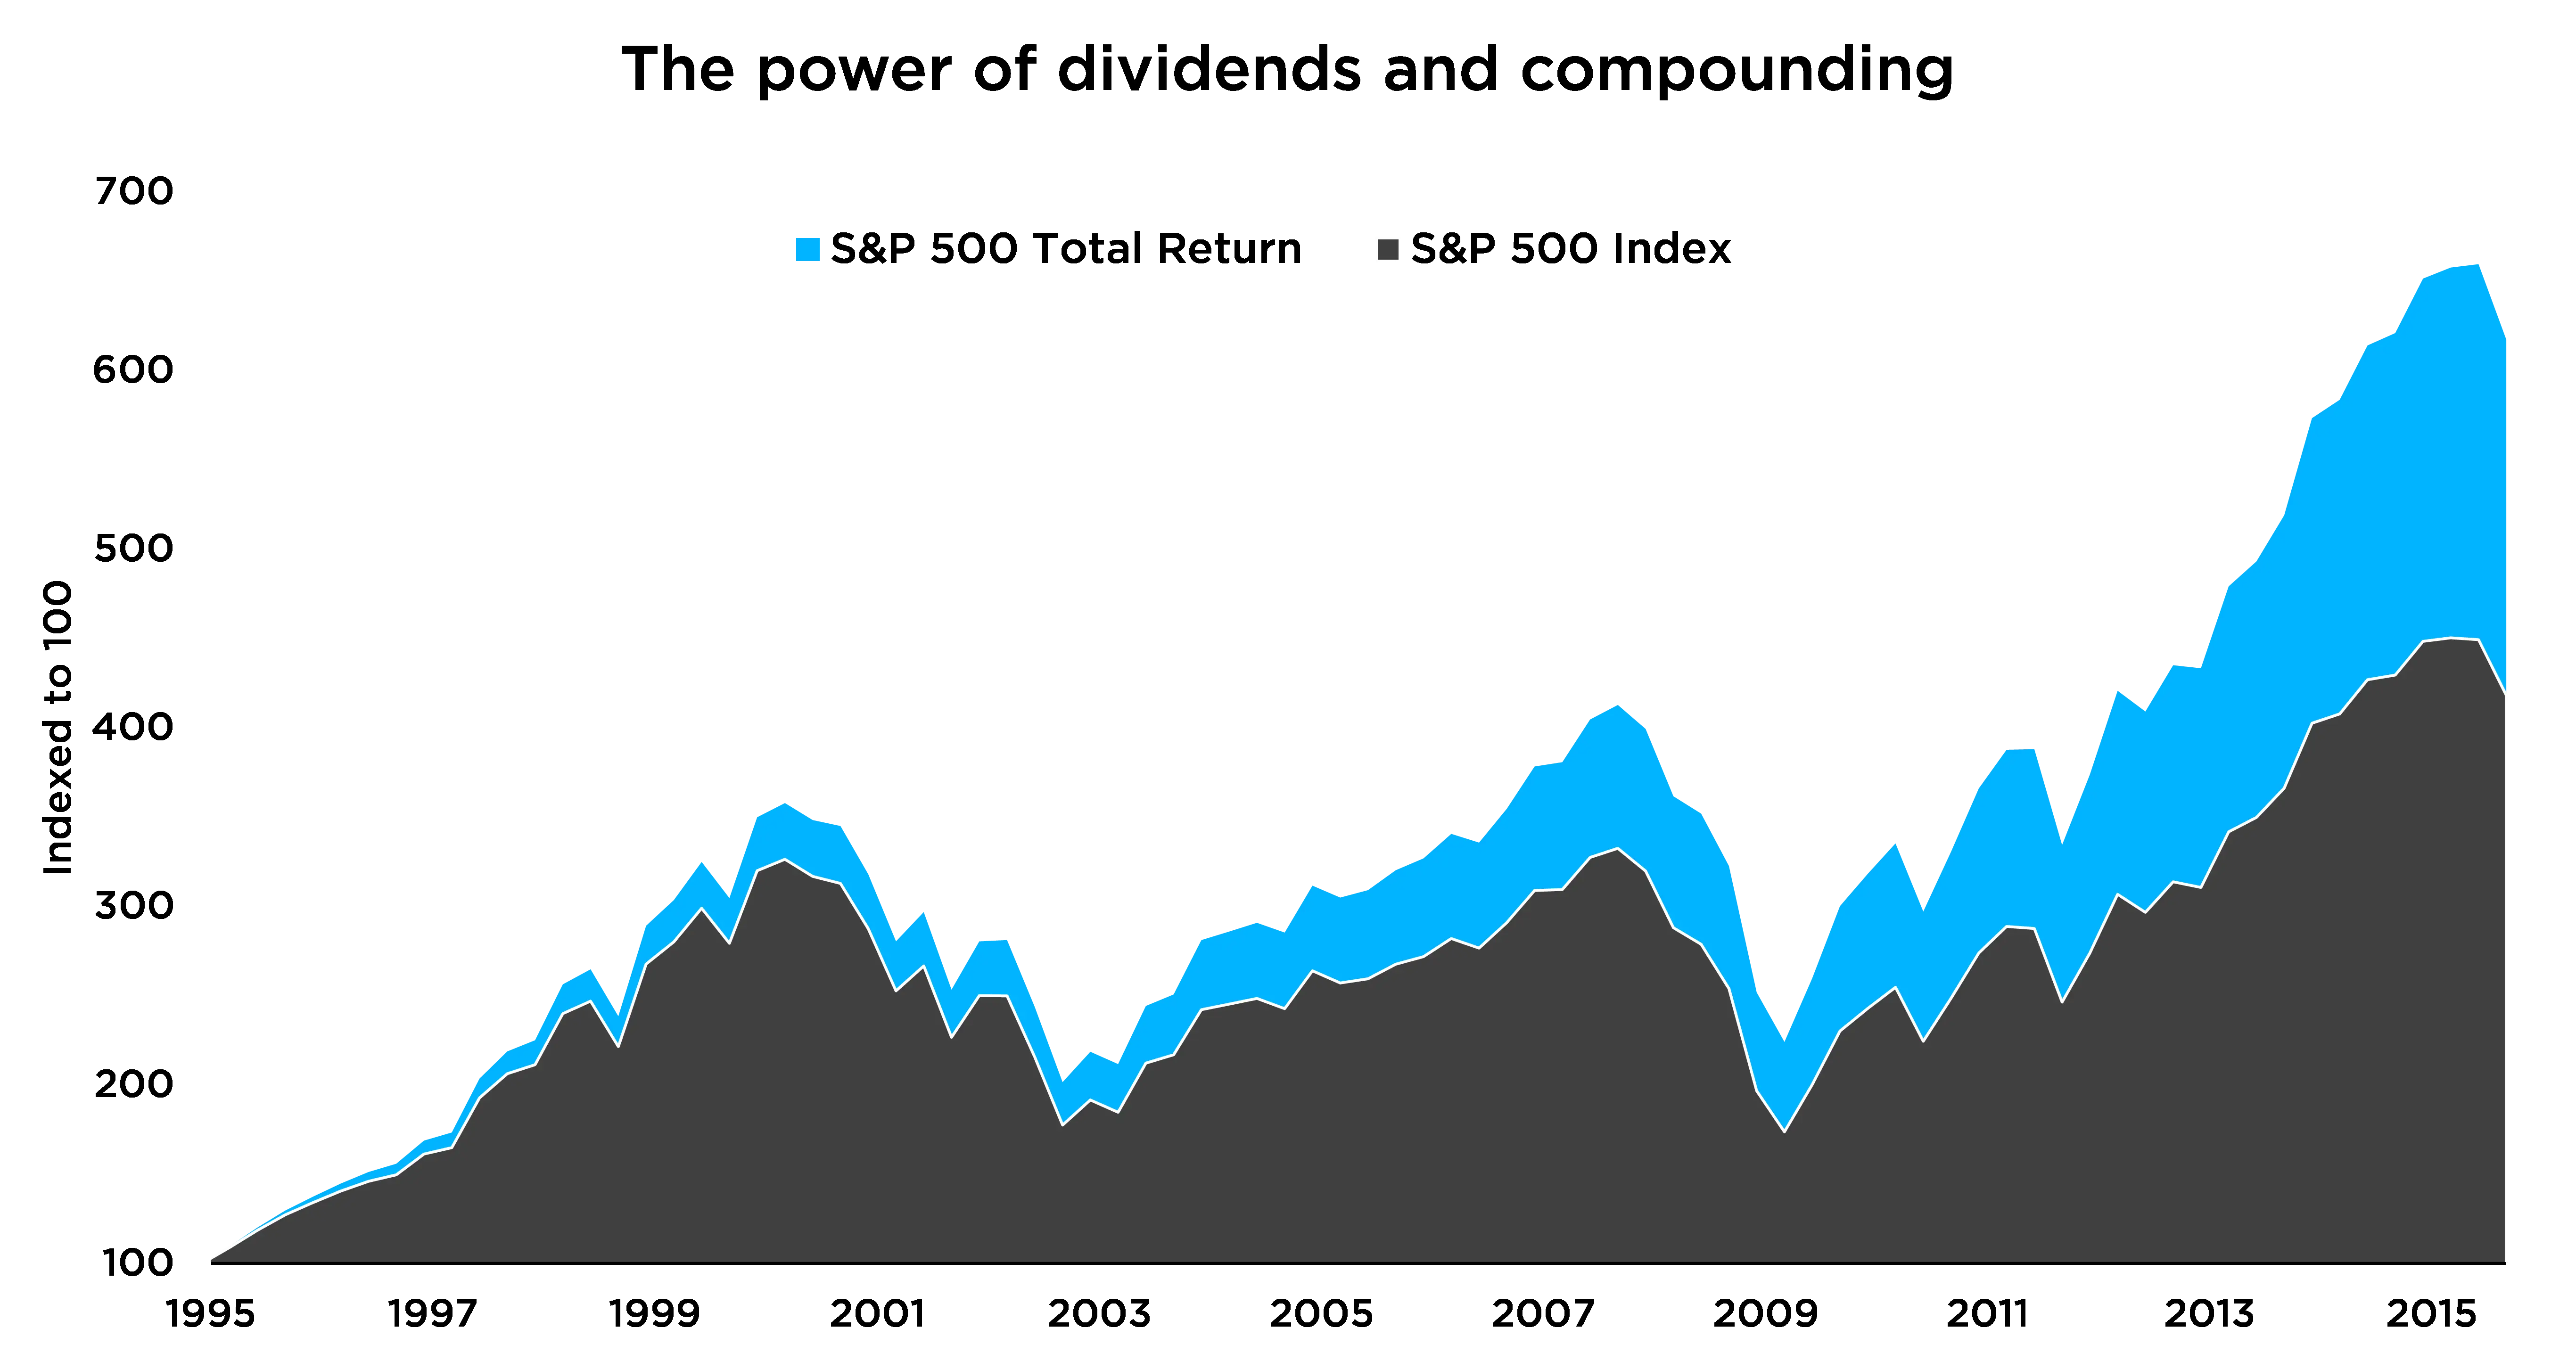
The Power of Dividends and Compounding Chart -
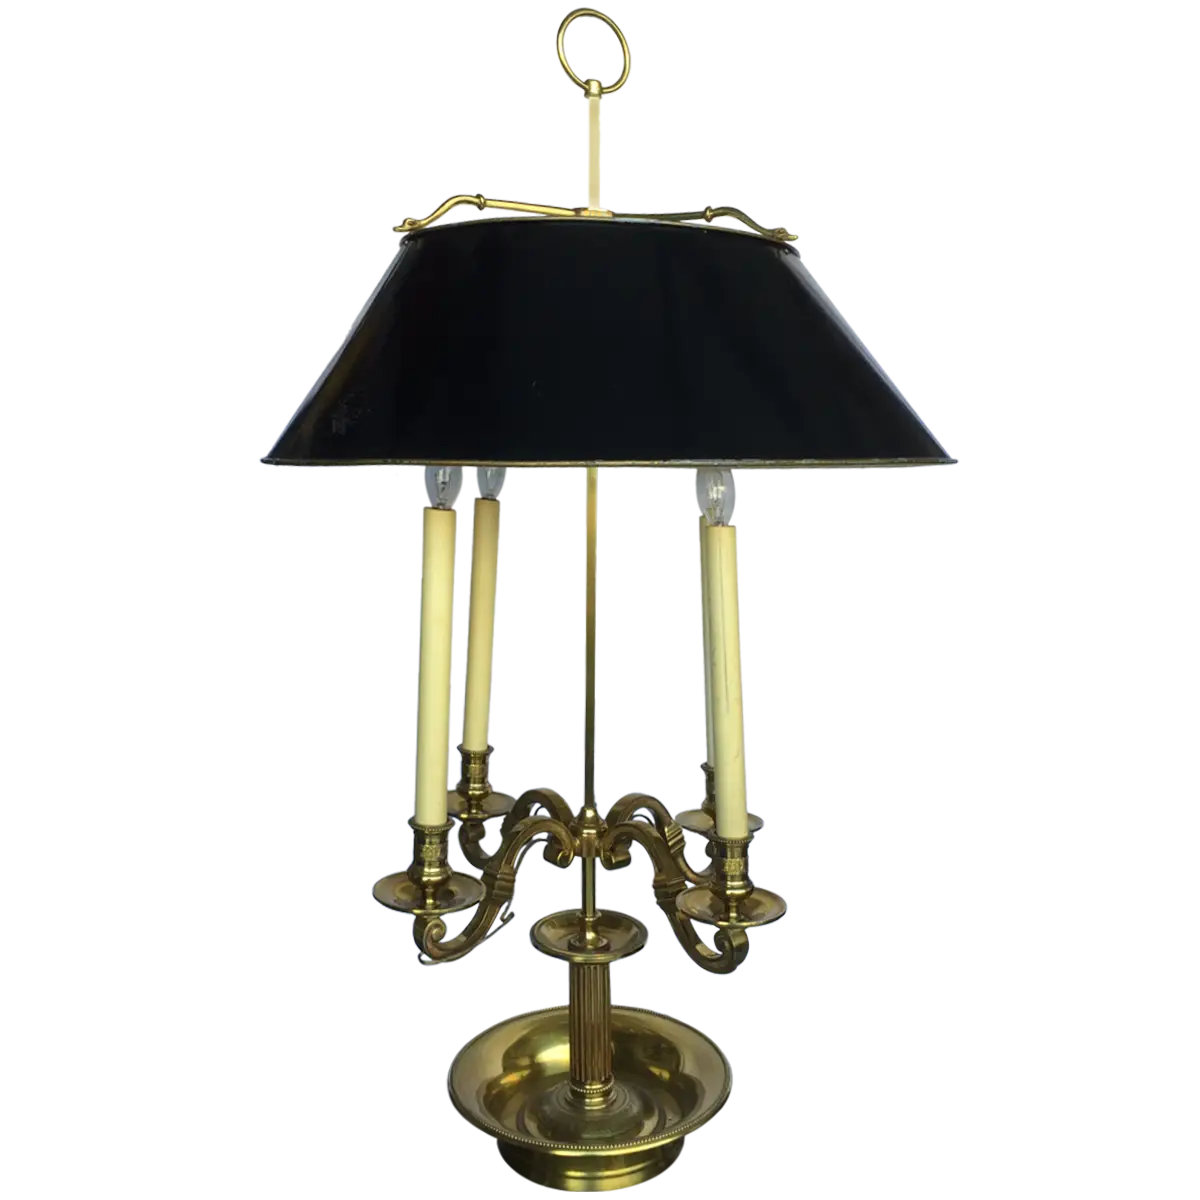
Black and Gold Candlestick Lamp for Classic Interiors -
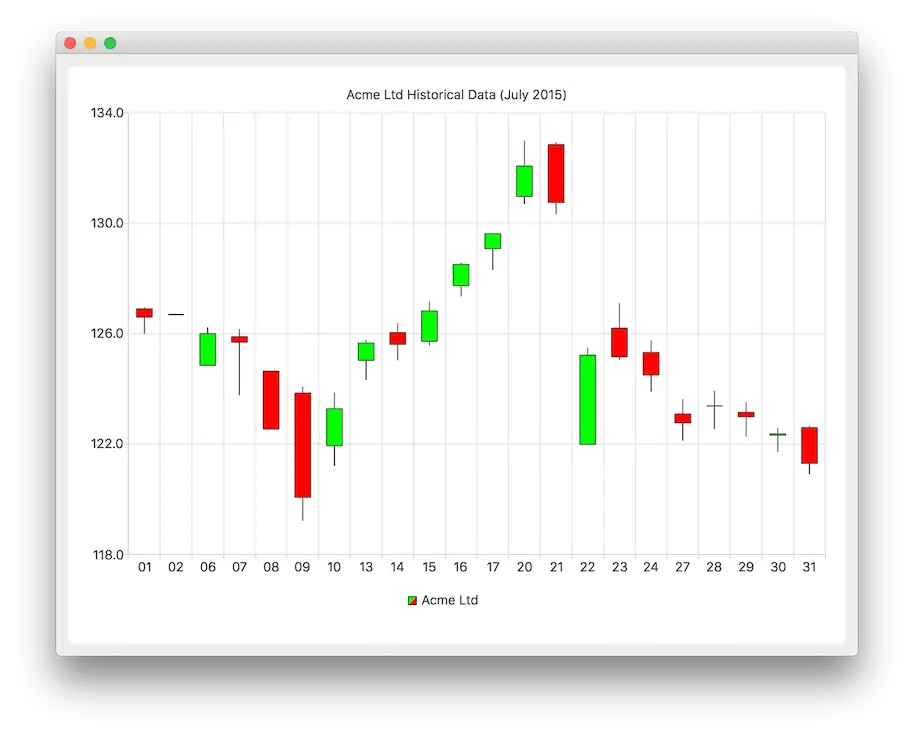
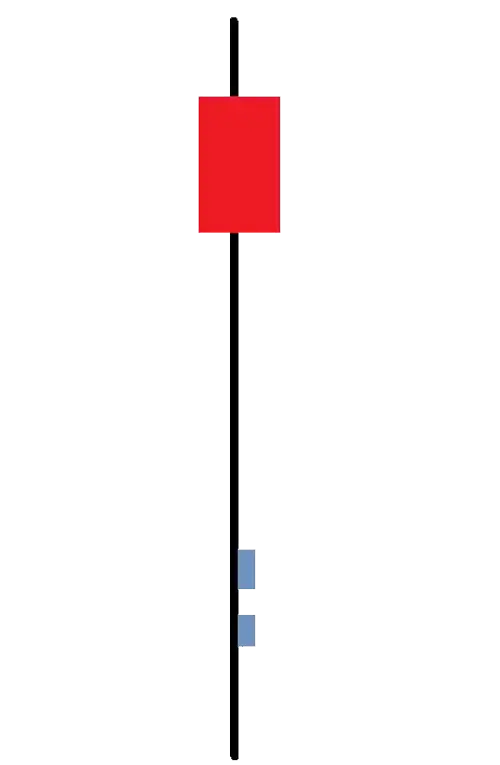
Stock Market Candlestick Chart -
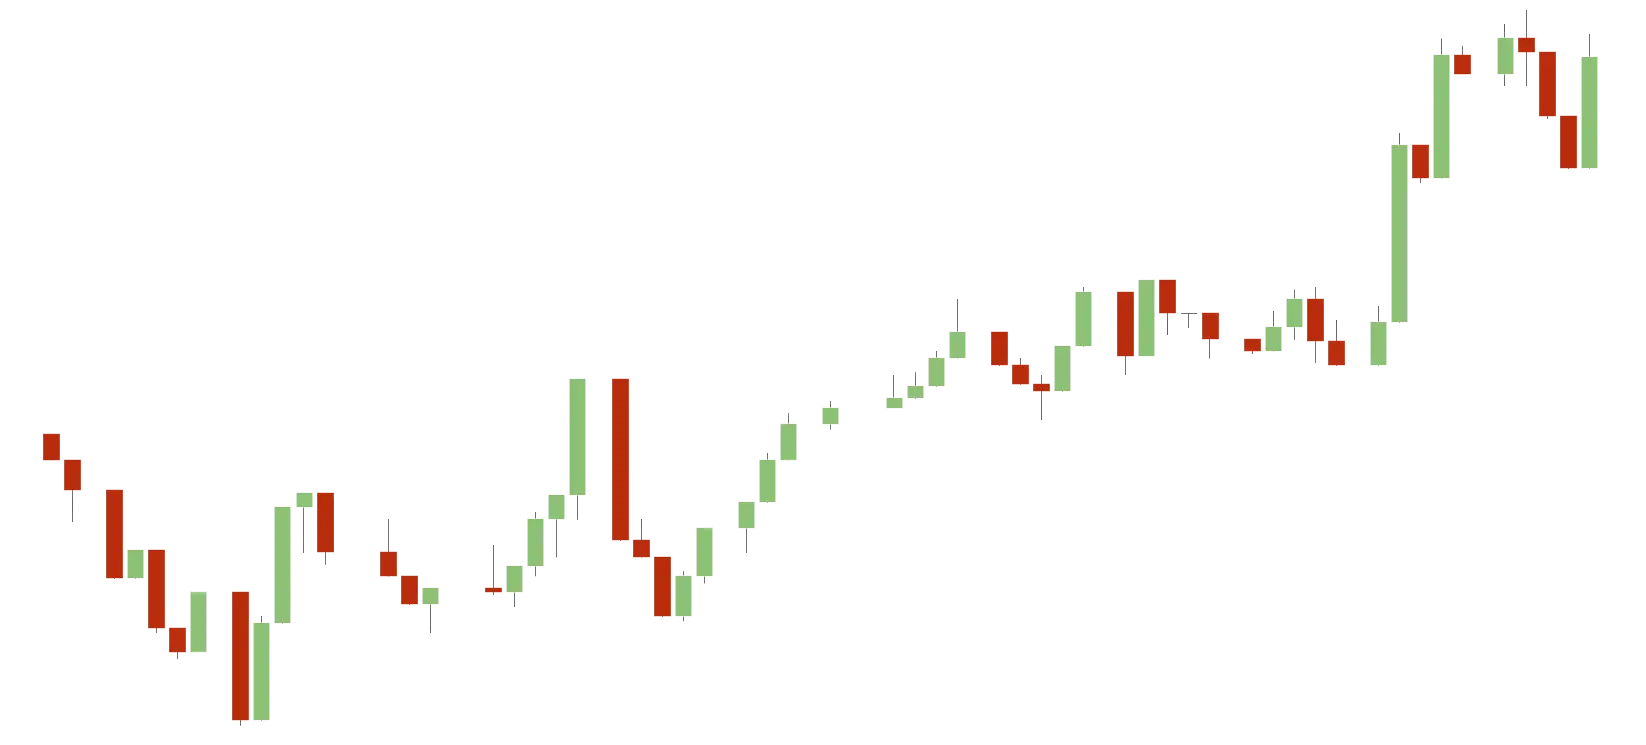
Stock Market Candlestick Chart for Analysis -
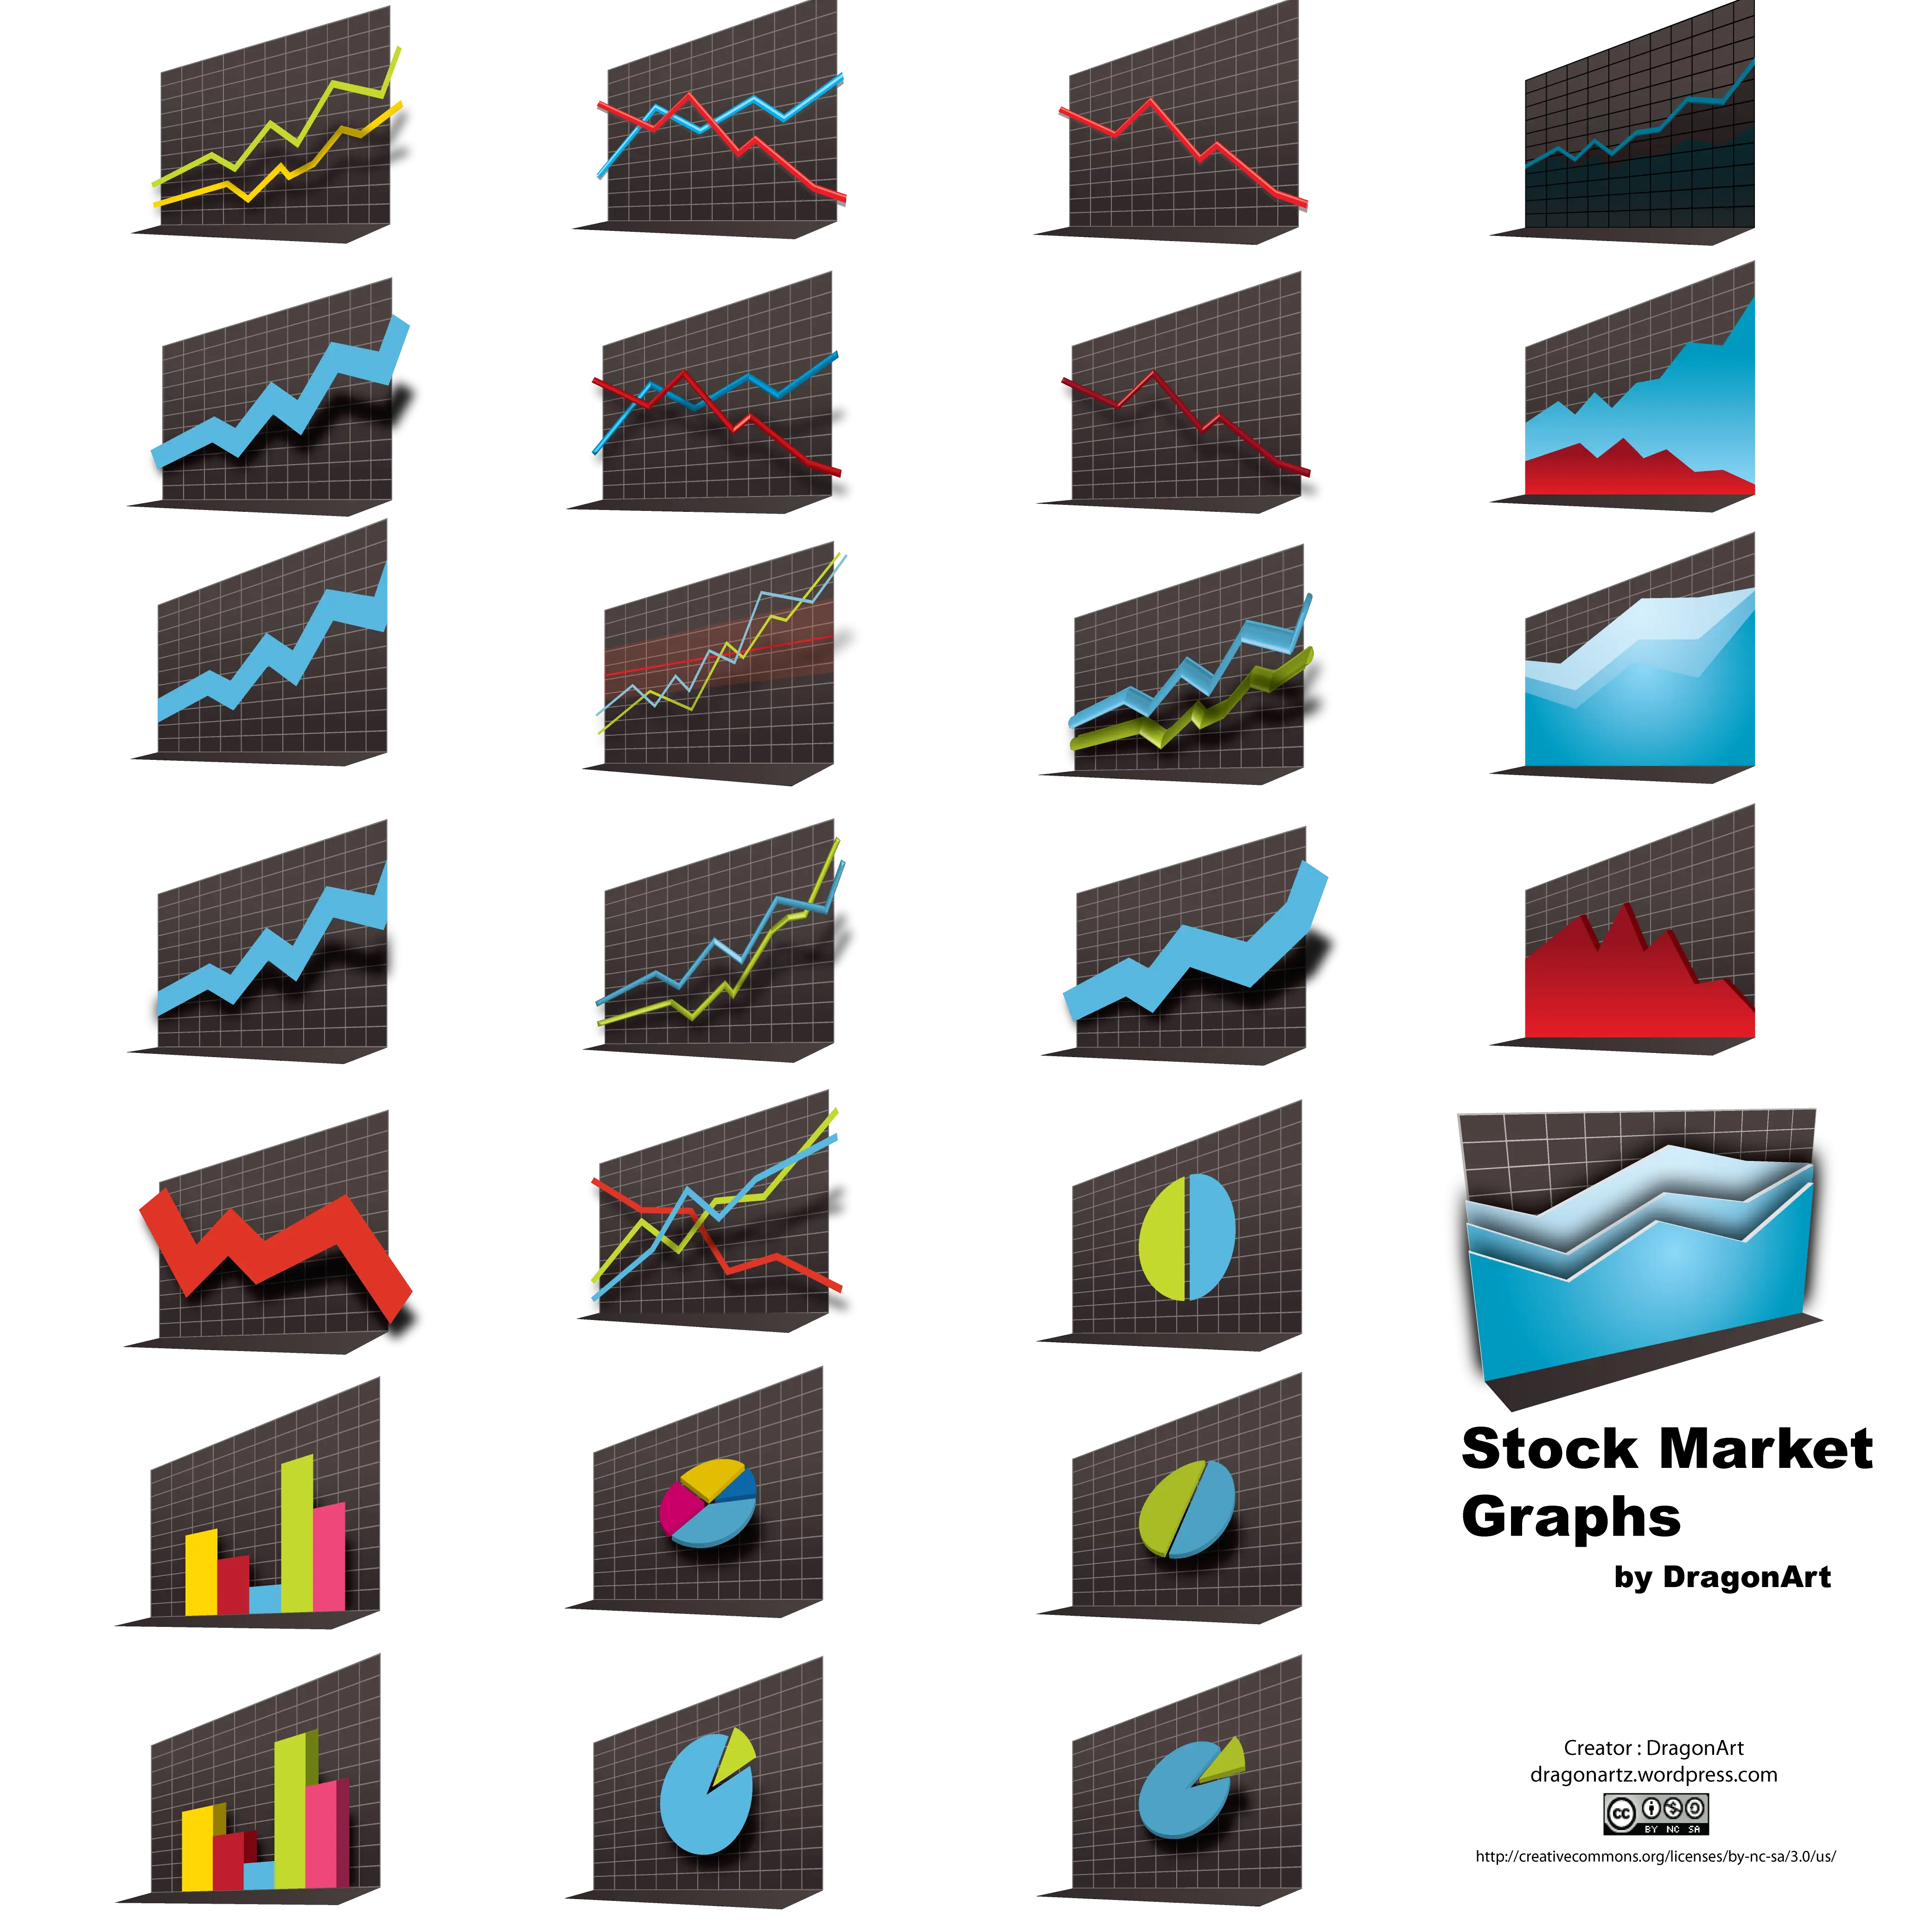
Stock Market Graphs Collection -

Candlestick Chart for Financial Analysis -
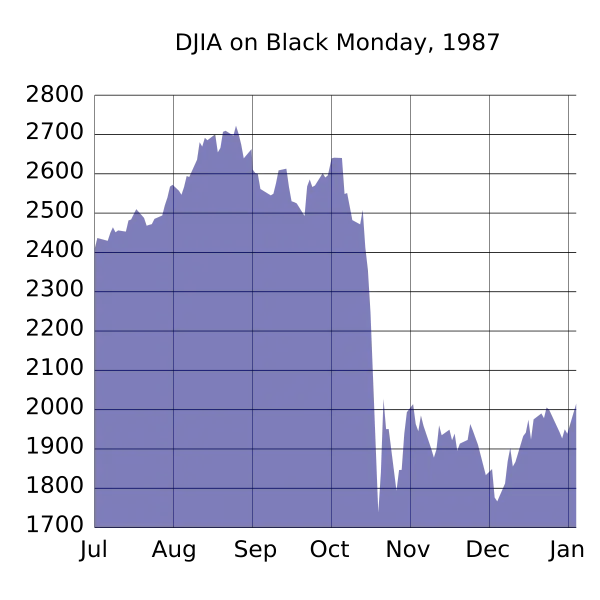
Stock Market Chart Showing Historical Trends