
You Might Like
-
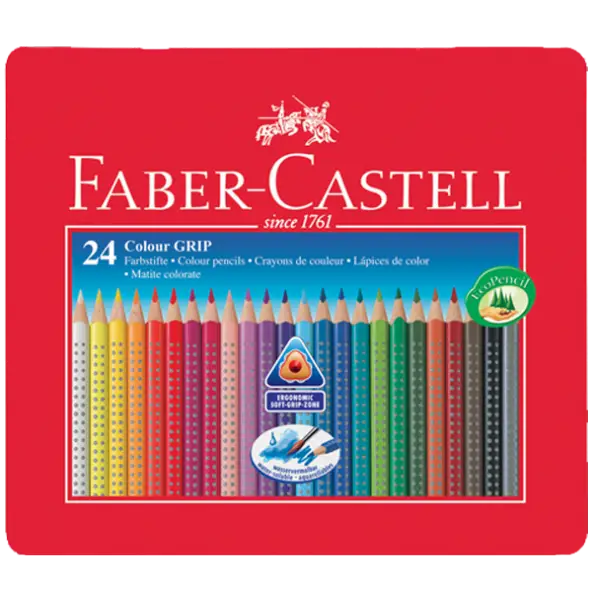
Faber-Castell Colored Pencils Set -

Colorful Art Supplies Illustration -

Back to School Banner with Stationery Icons -

Business Icons Set for Digital Workflows -

Colorful Stationery Set -

Clipboard Illustration with Financial Chart for Data Analysis -
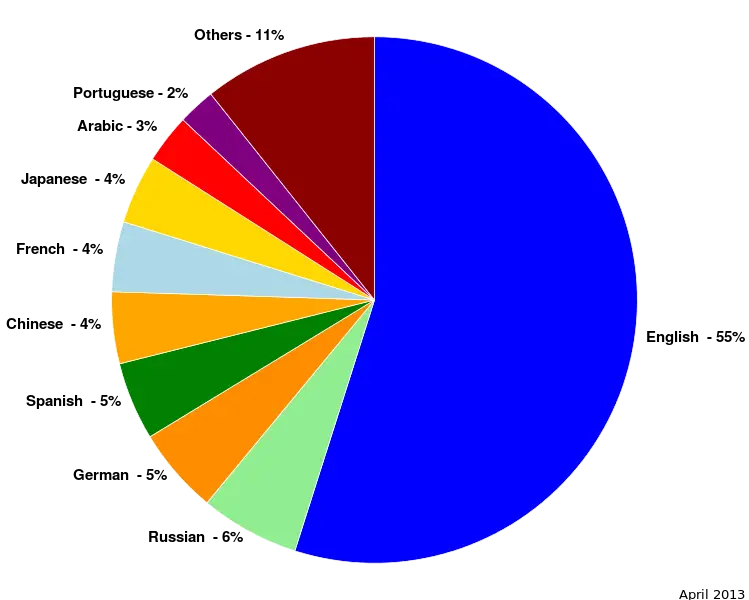
Colorful Statistical Pie Chart -

Calculator and Chart Icon for Data Analysis -

Creative Colorful Pencil Wreath Design -
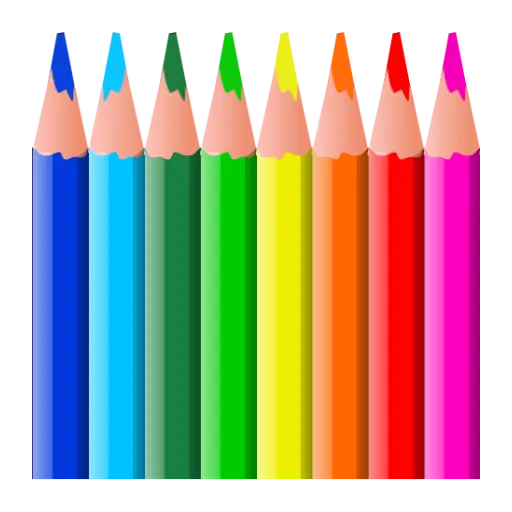
Bright Colored Pencils for Art and Creativity -
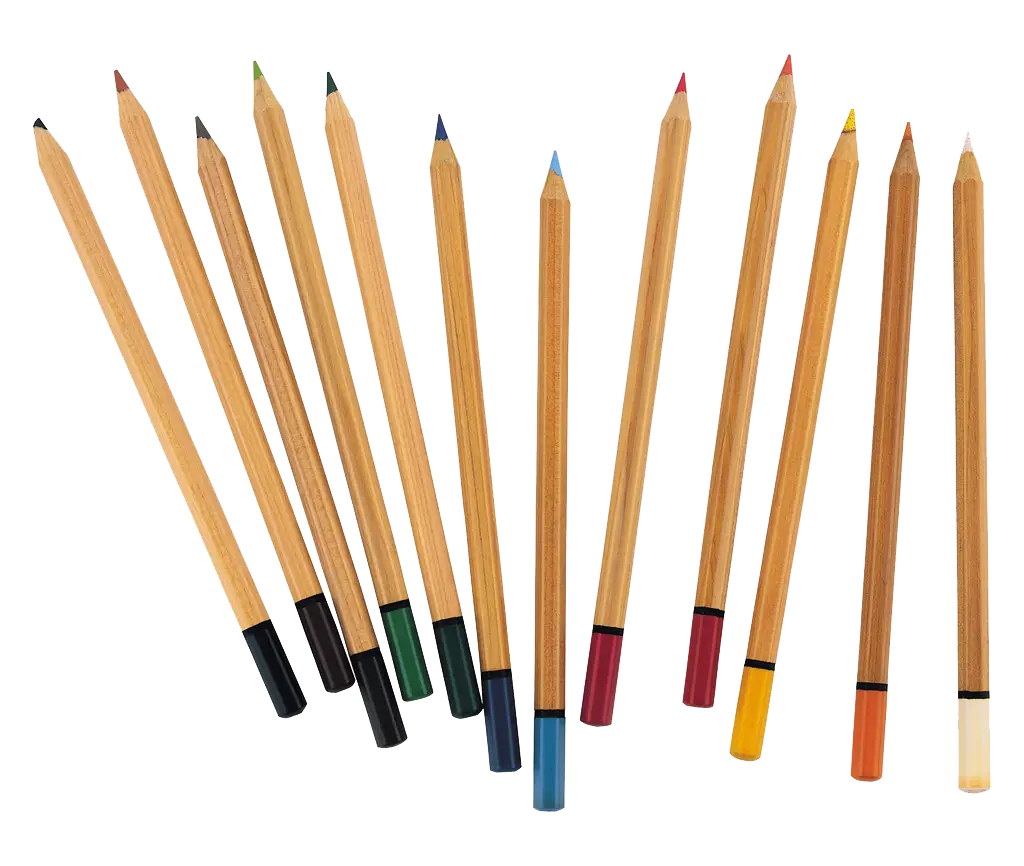
Set of Colored Pencils -

Mobile Data Analysis Graph -
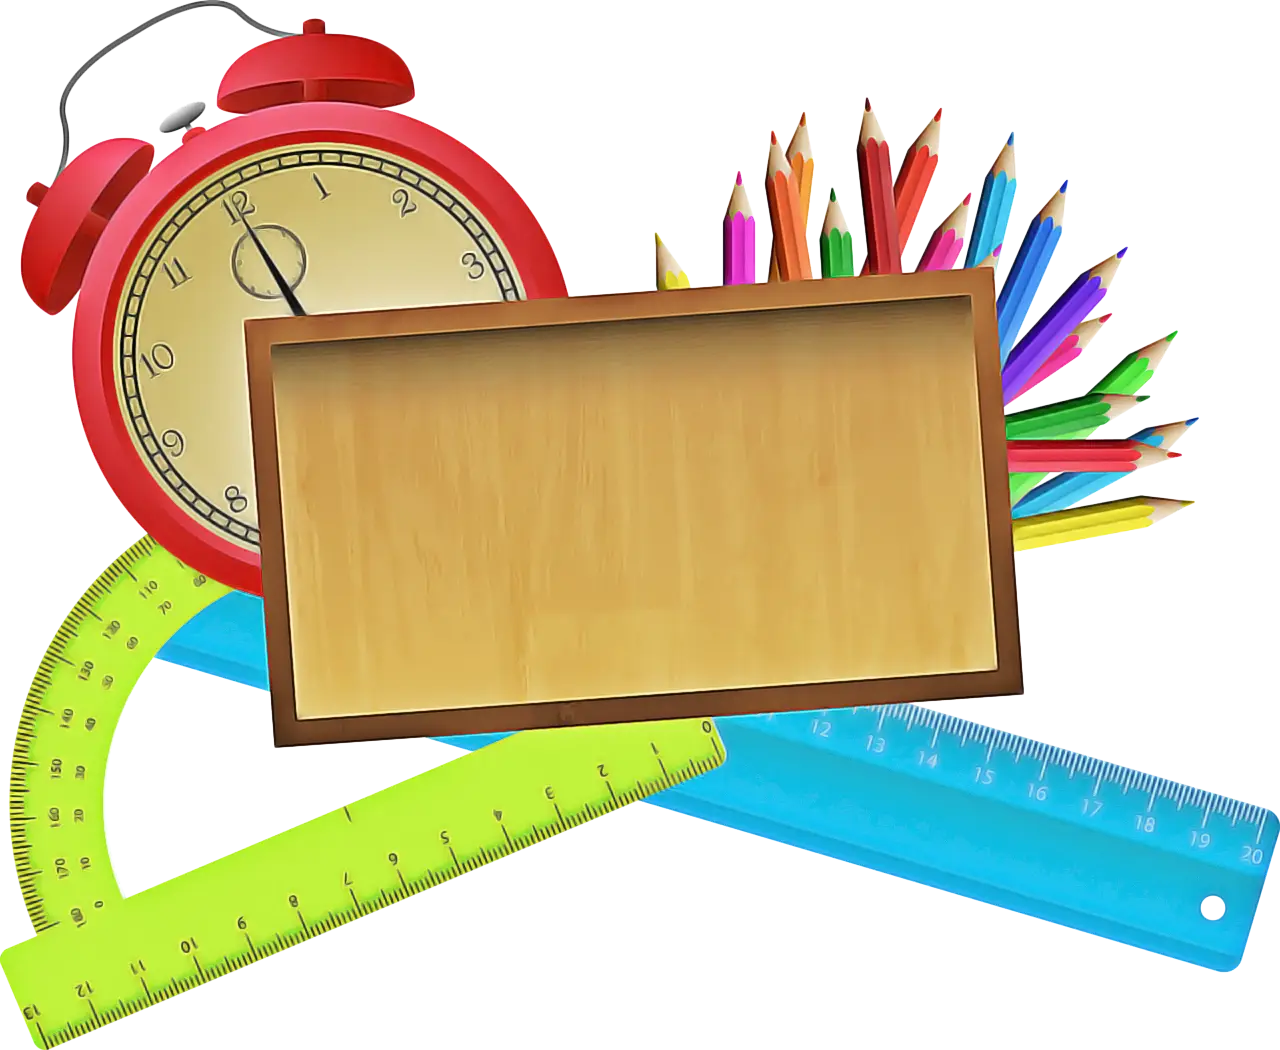
School Supplies Set with Wooden Chalkboard -

Tablet with Graphs and Data Analysis -

Data Analysis Icon -

Digital Chart and Interactive Graphs on Mobile Device Illustration -
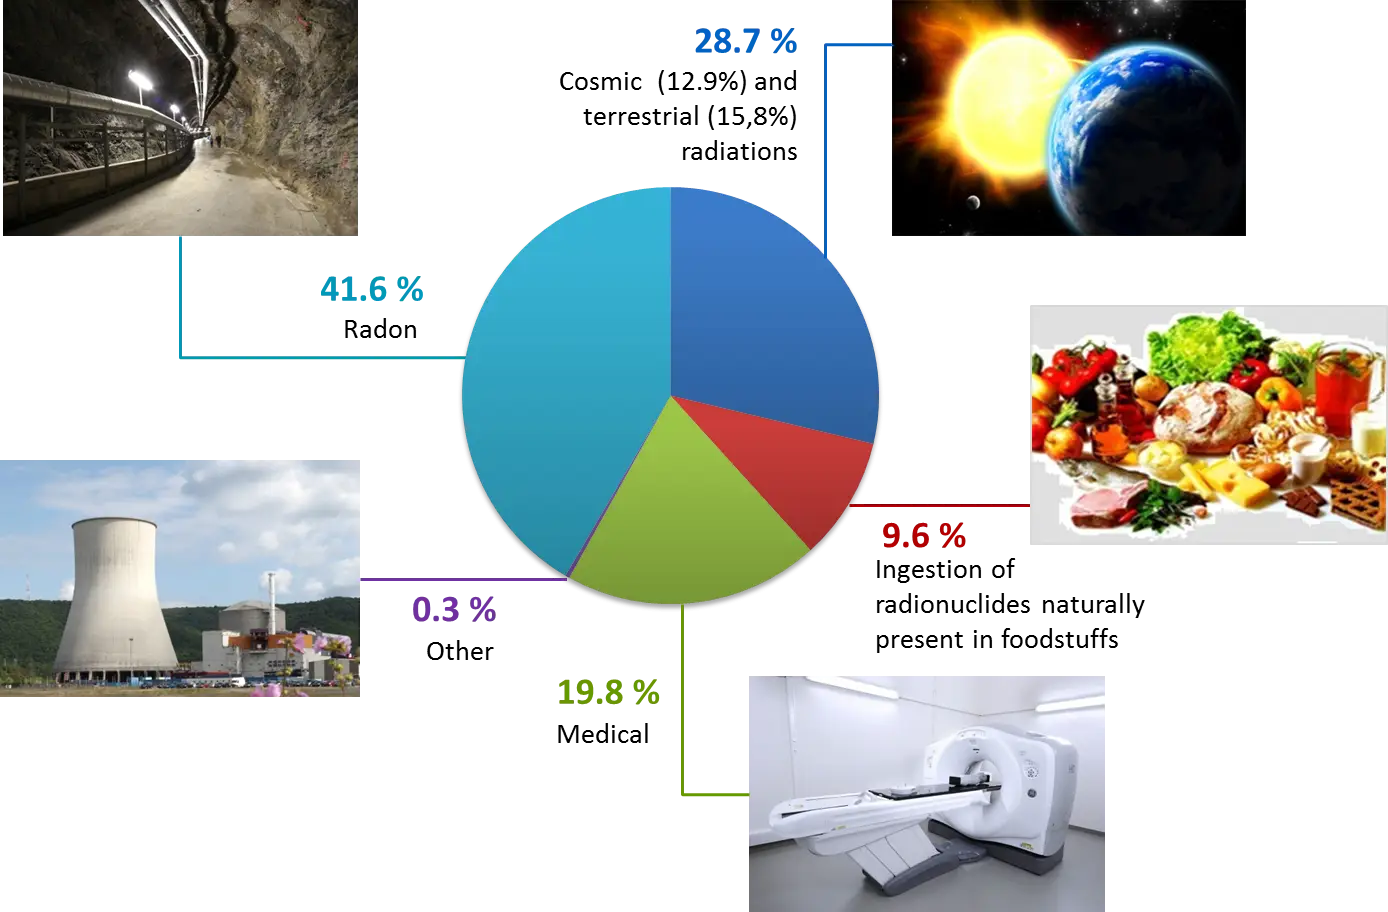
Radiation Sources Pie Chart Infographic -
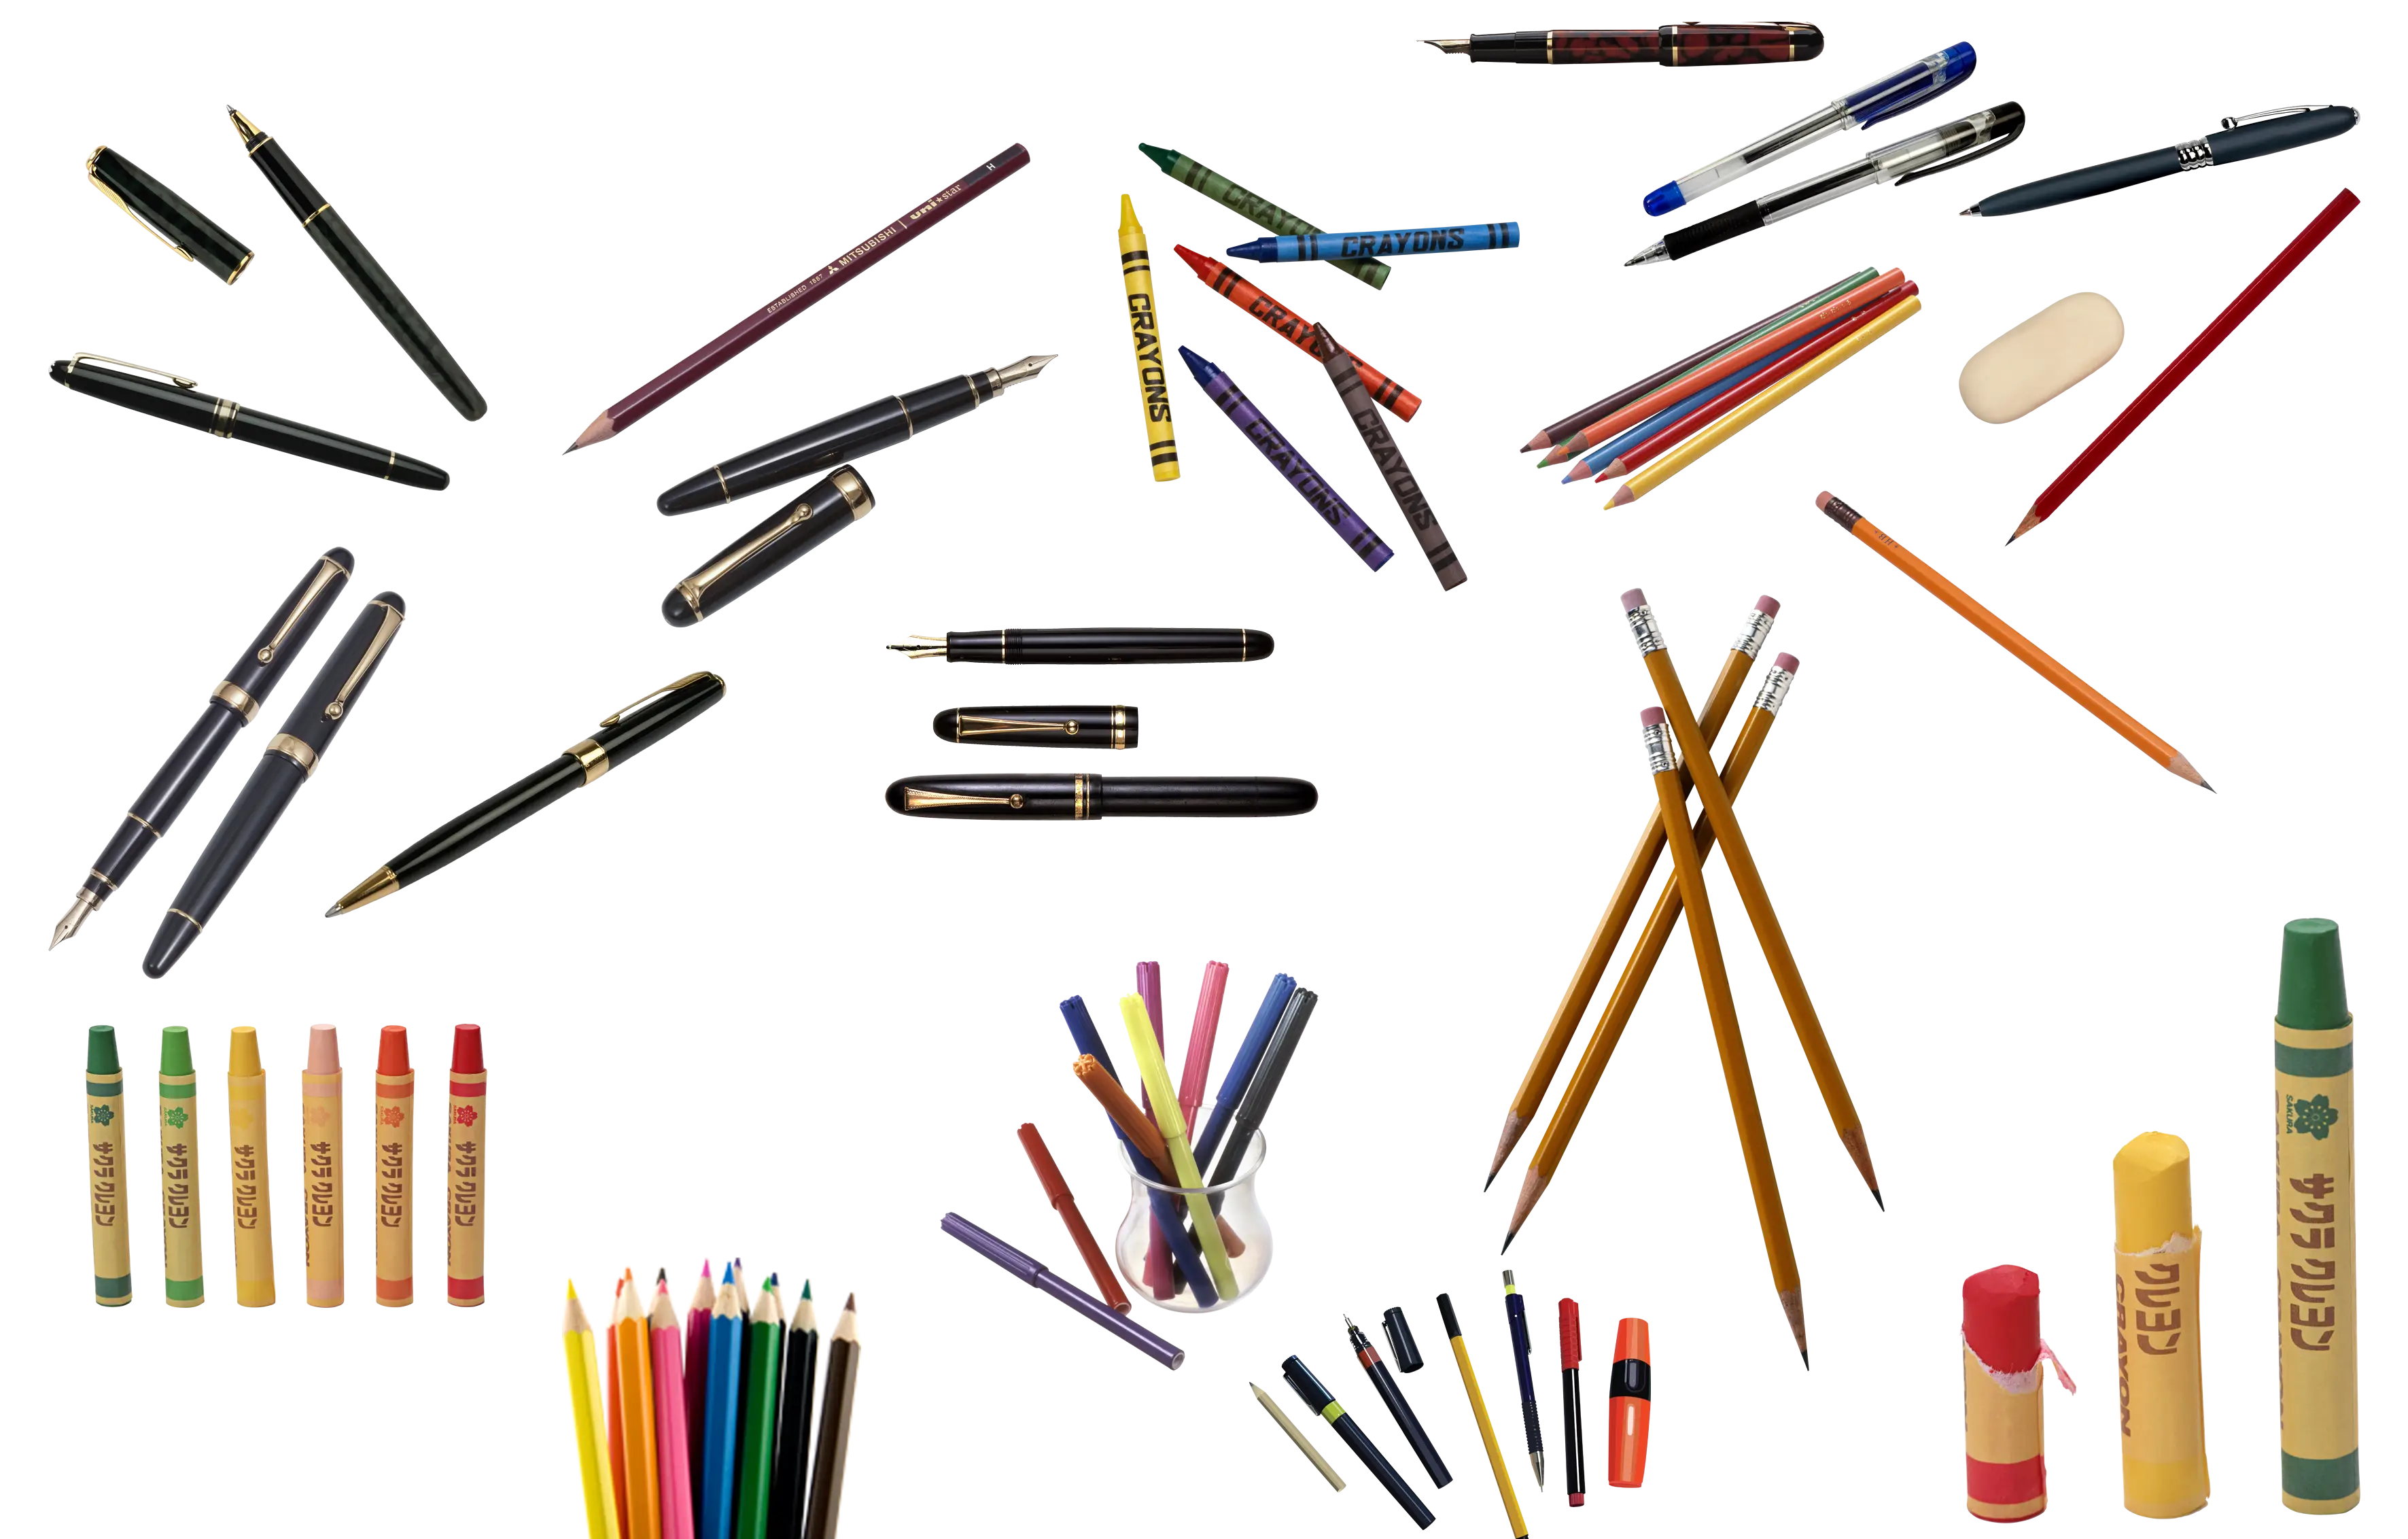
Various Writing Instruments and Stationery Items -

Computer Screen Displaying Analytics Graphs -

Data Analysis Bar Chart on Monitor -
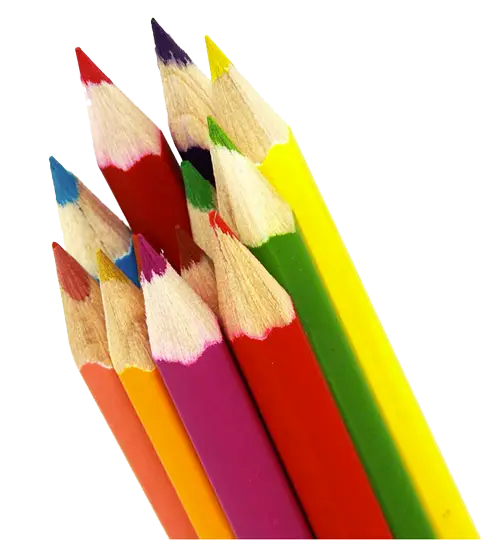
Stacked Colored Pencils in Vibrant Colors -

Set of Painting Brushes Illustration -
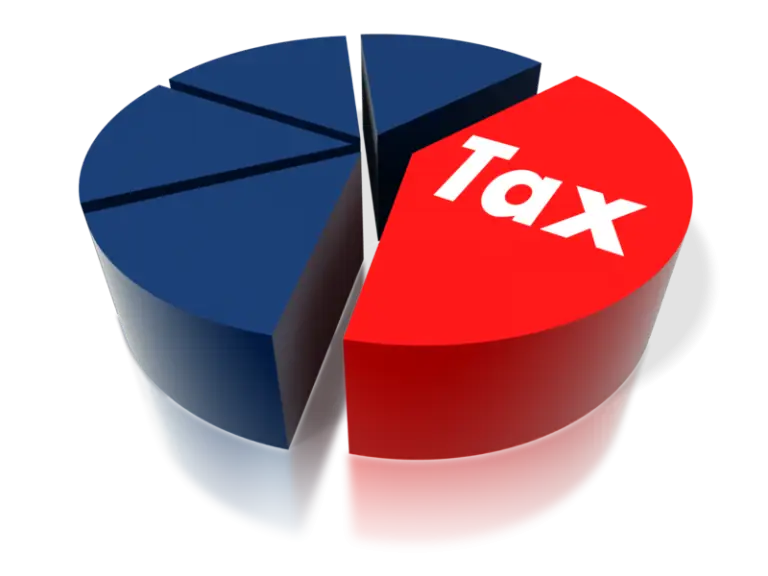
Tax Pie Chart Illustration -

Businessman Presenting Data on Laptop Illustration -

Analytics Visual Dashboard Illustration -
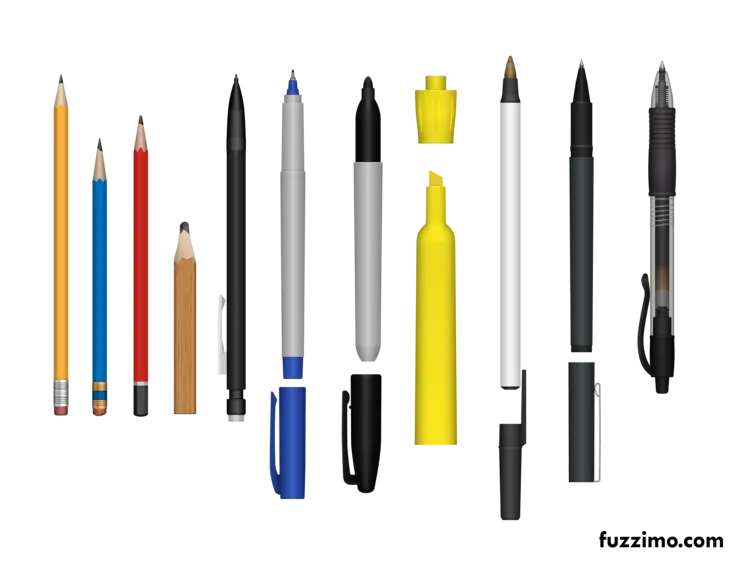
Assorted Pencils and Pens -
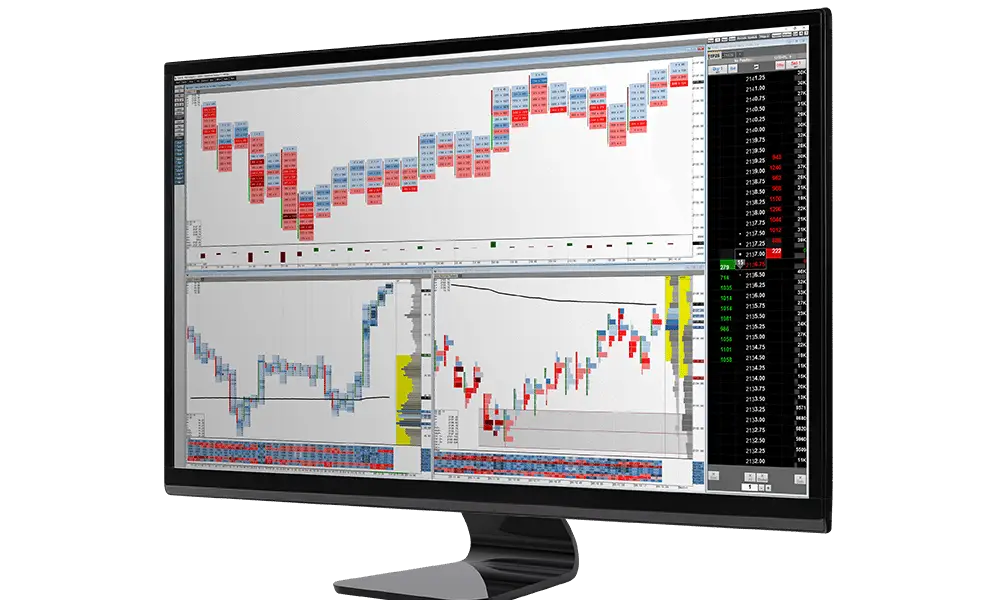
Trading Monitor with Financial Data Display -
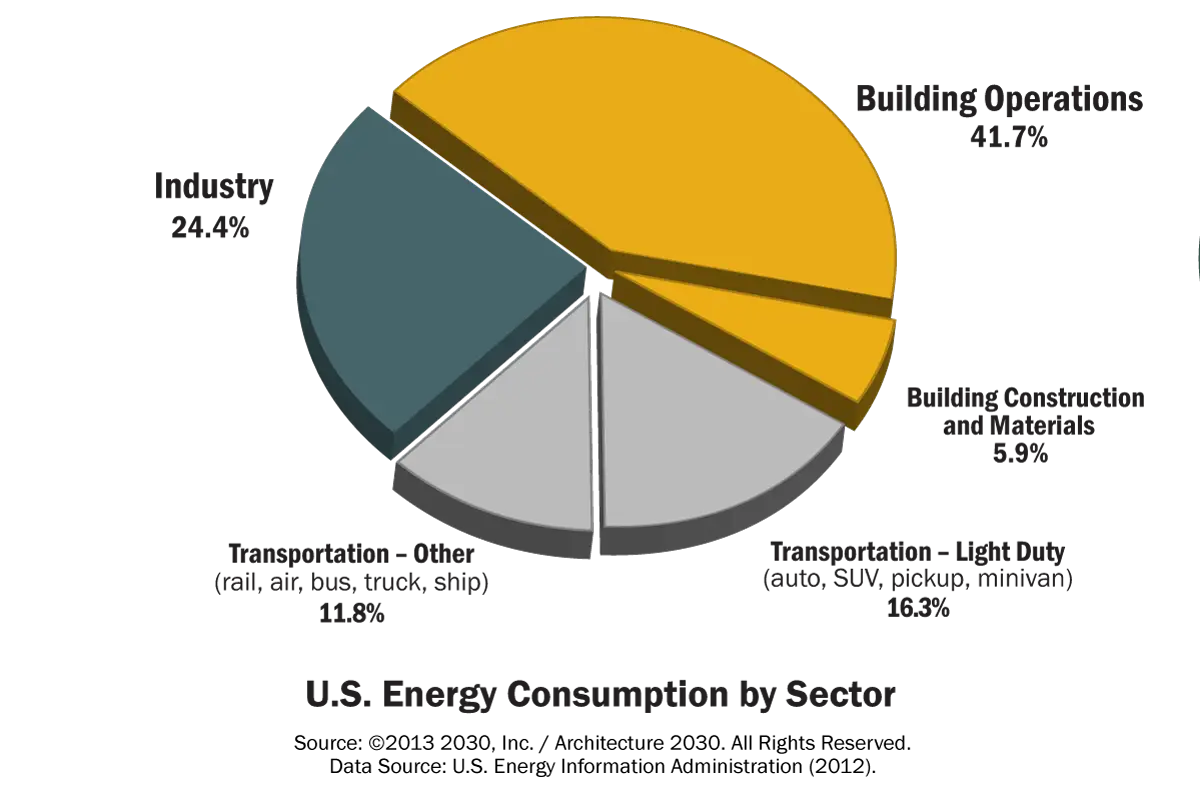
Pie Chart of U.S. Energy Consumption by Sector -

Data Analysis on Computer Screen Icon -

School Chalkboard with Books and Accessories