You Might Like
-

Emotional Feedback Pie Chart -
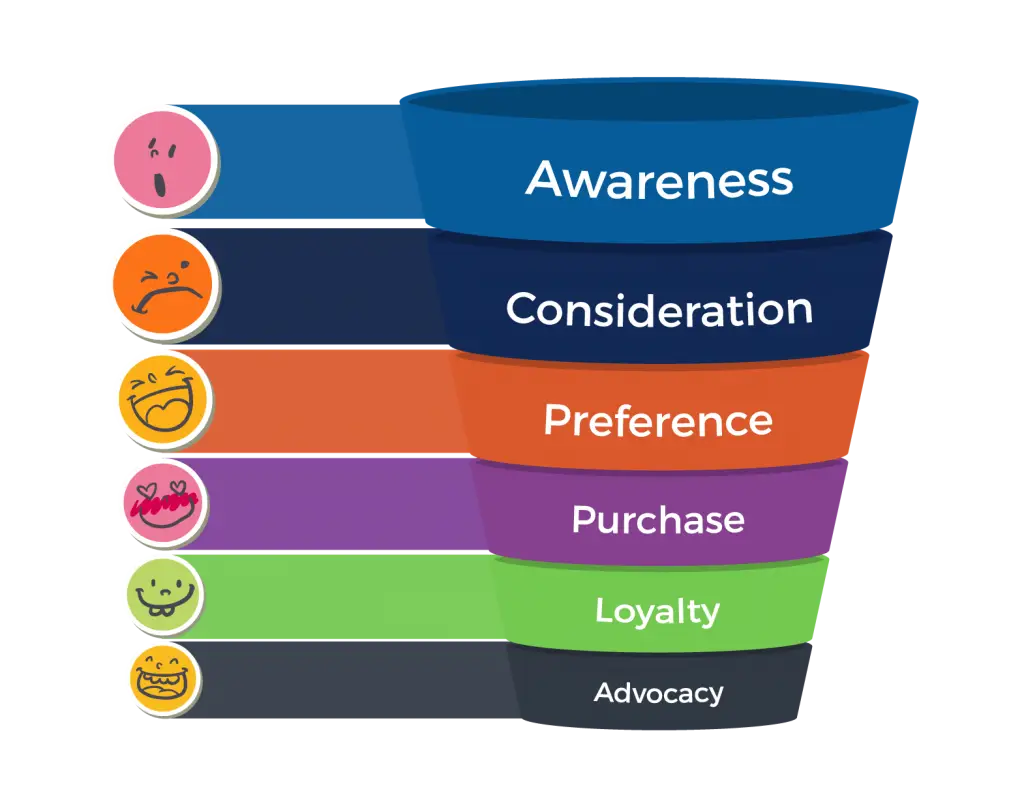
Marketing Funnel Diagram -
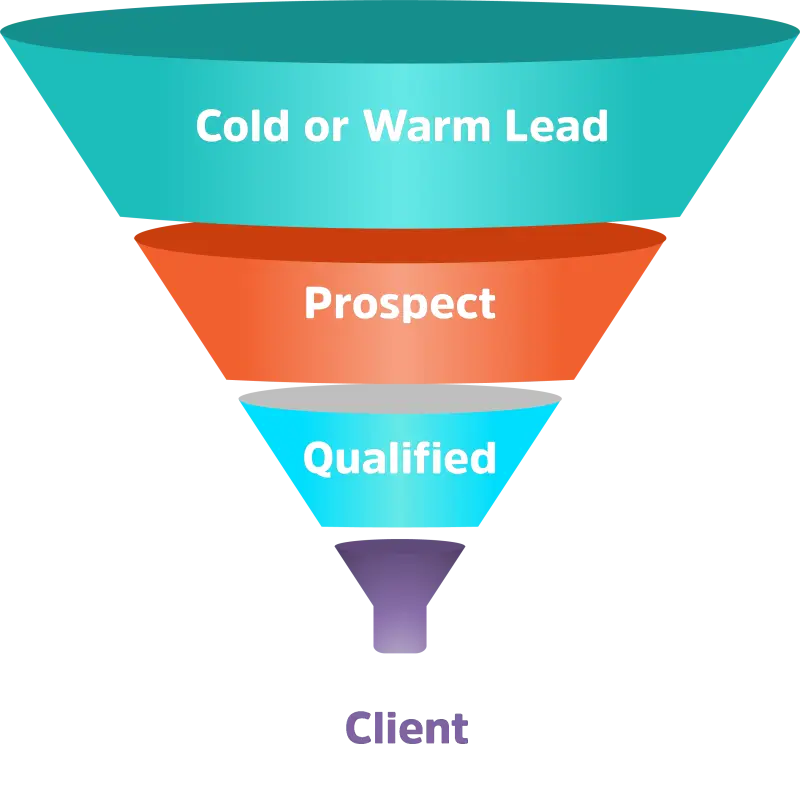
Sales Funnel Diagram for Client Conversion -

Shopping Cart with Digital Marketing Icons -

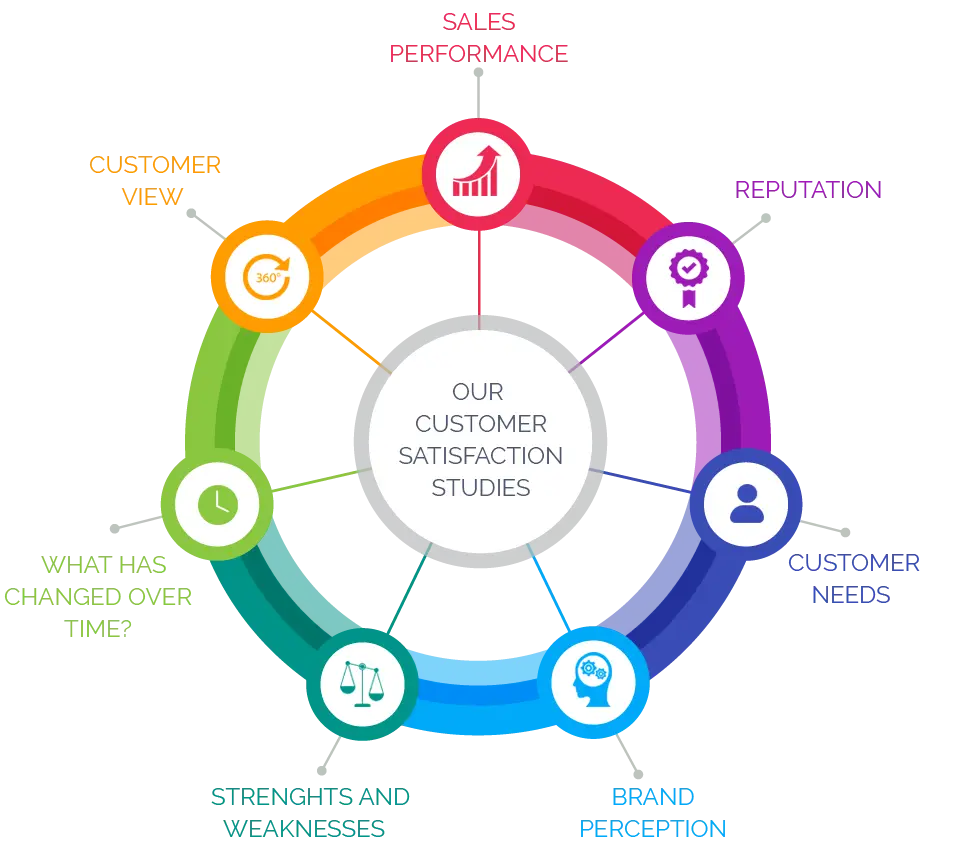
Market Research Icons -
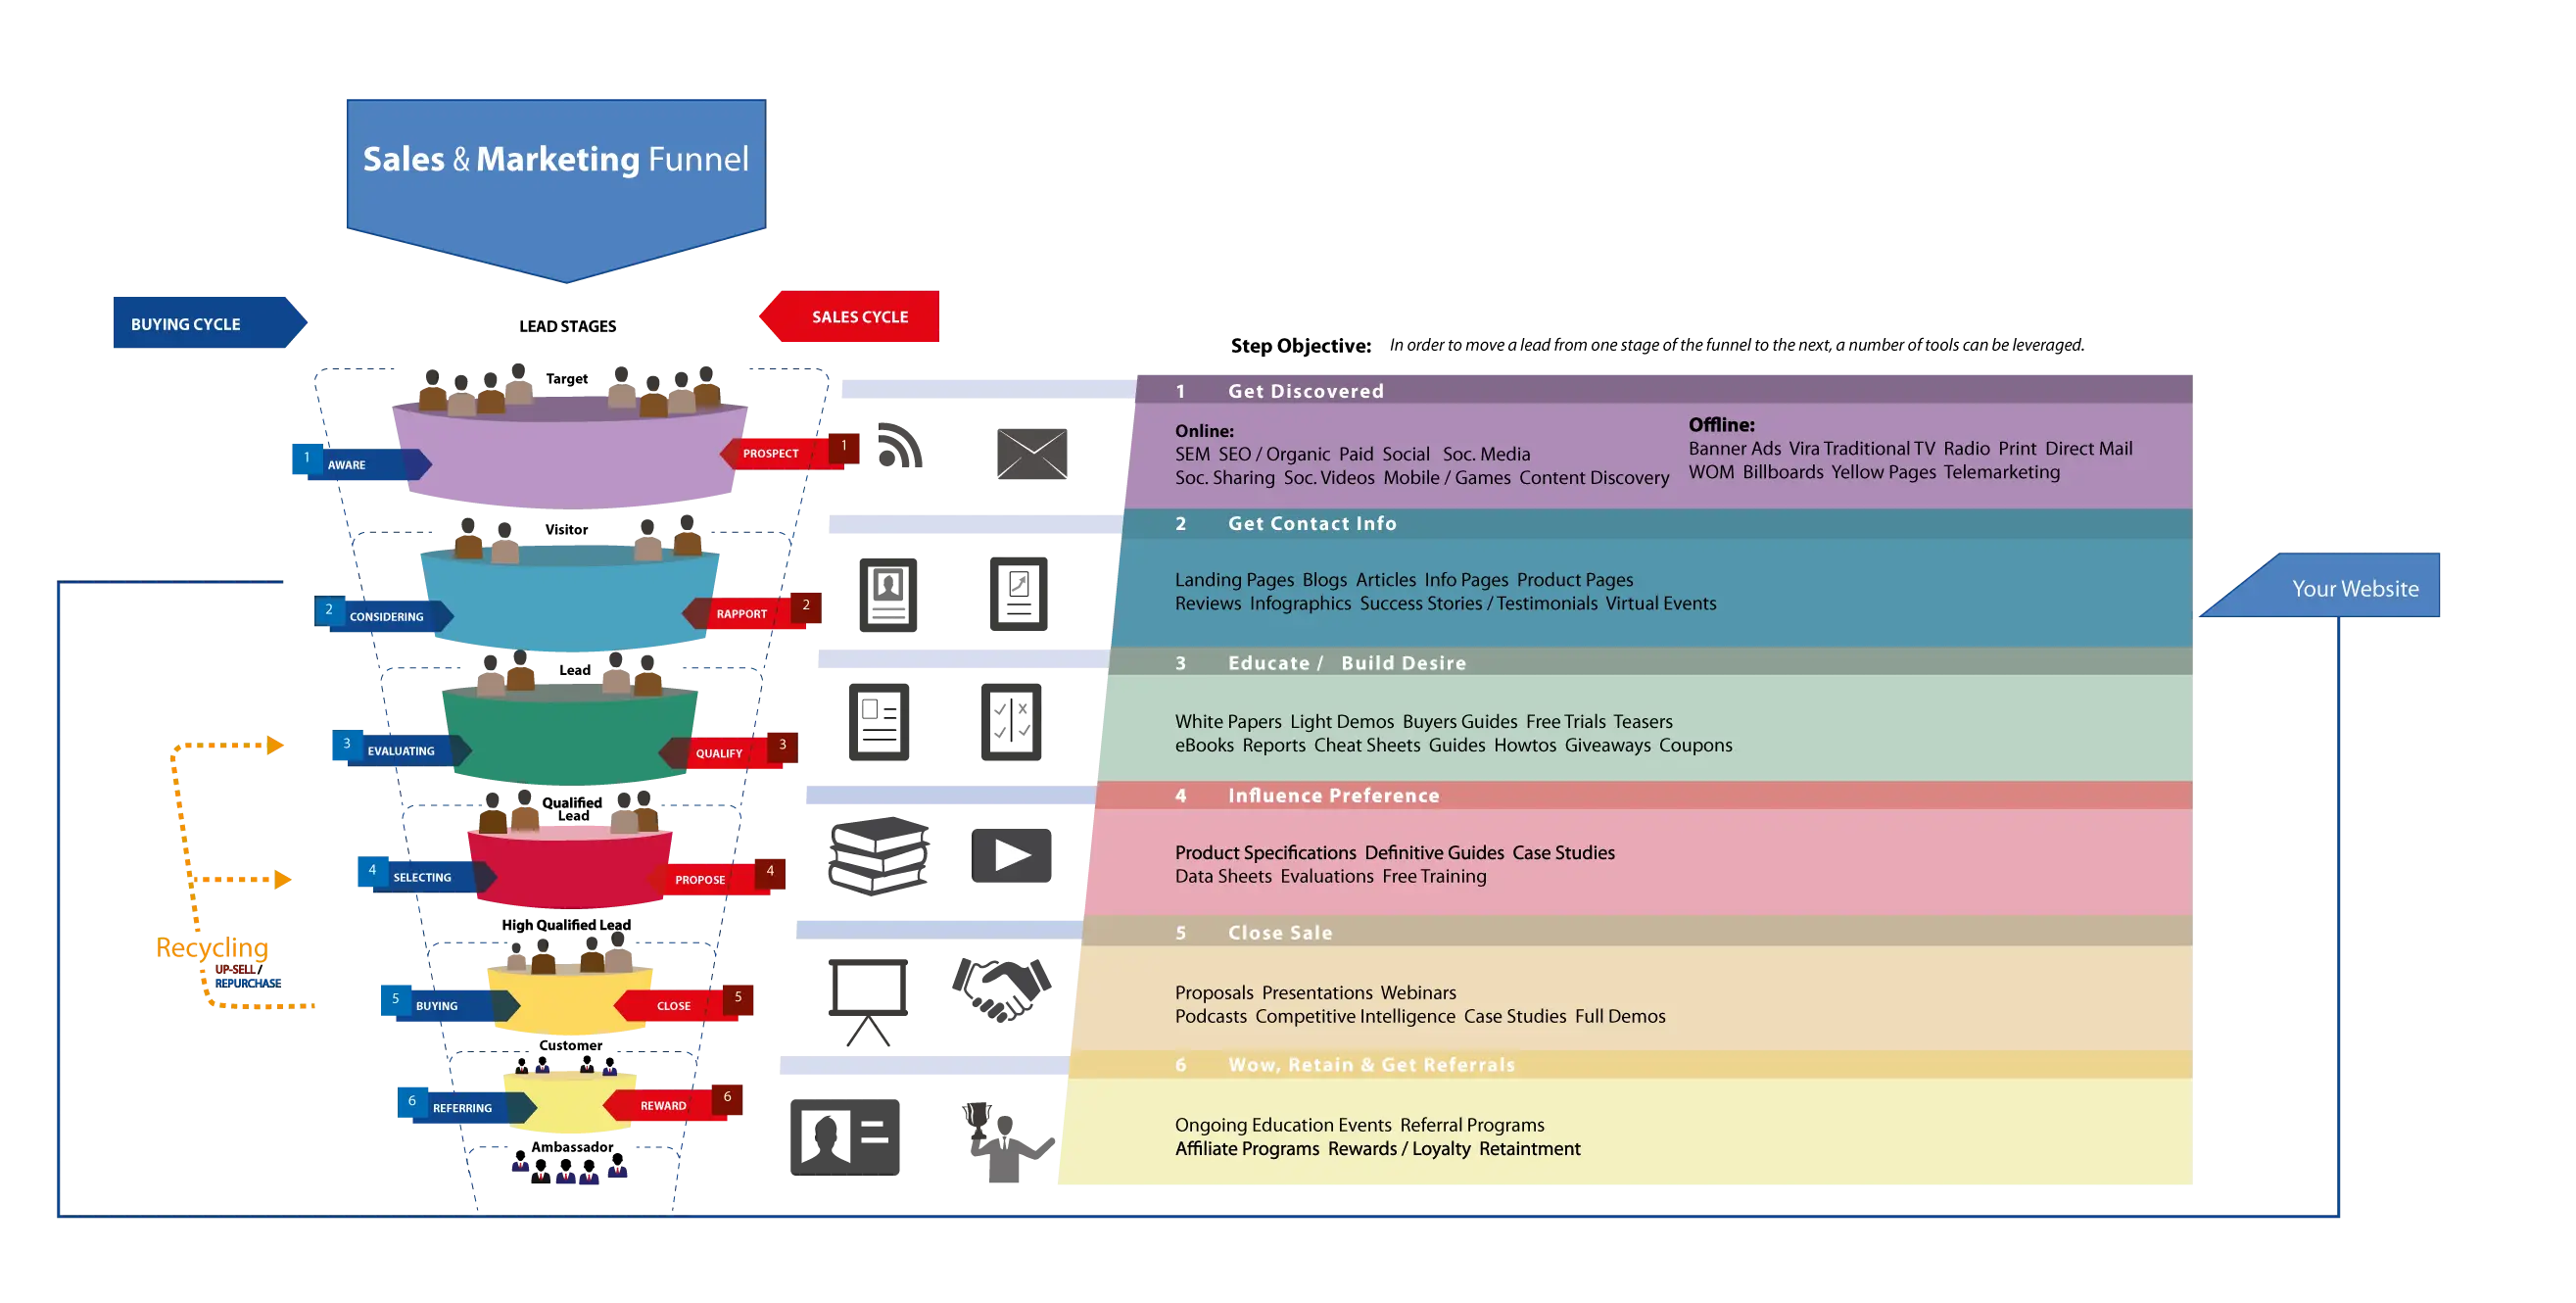
Sales and Marketing Funnel Diagram -
Marketing Objectives with Charts -

Four and a Half Star Rating -
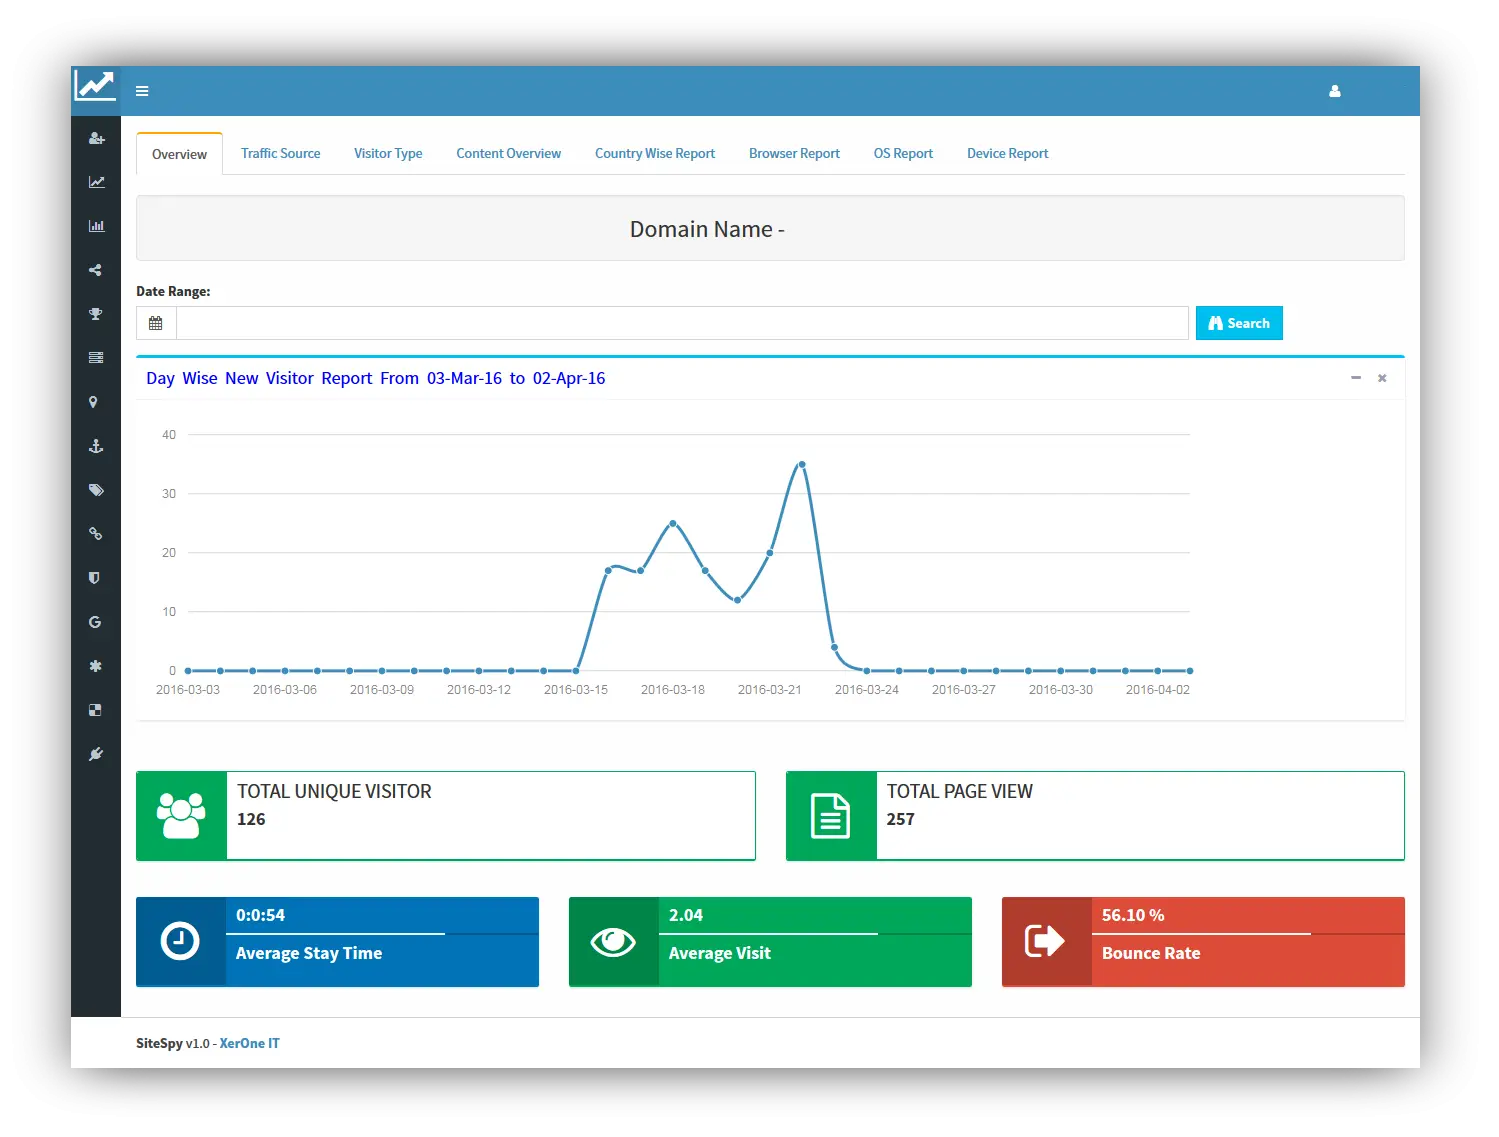
Website Analytics Dashboard Display -
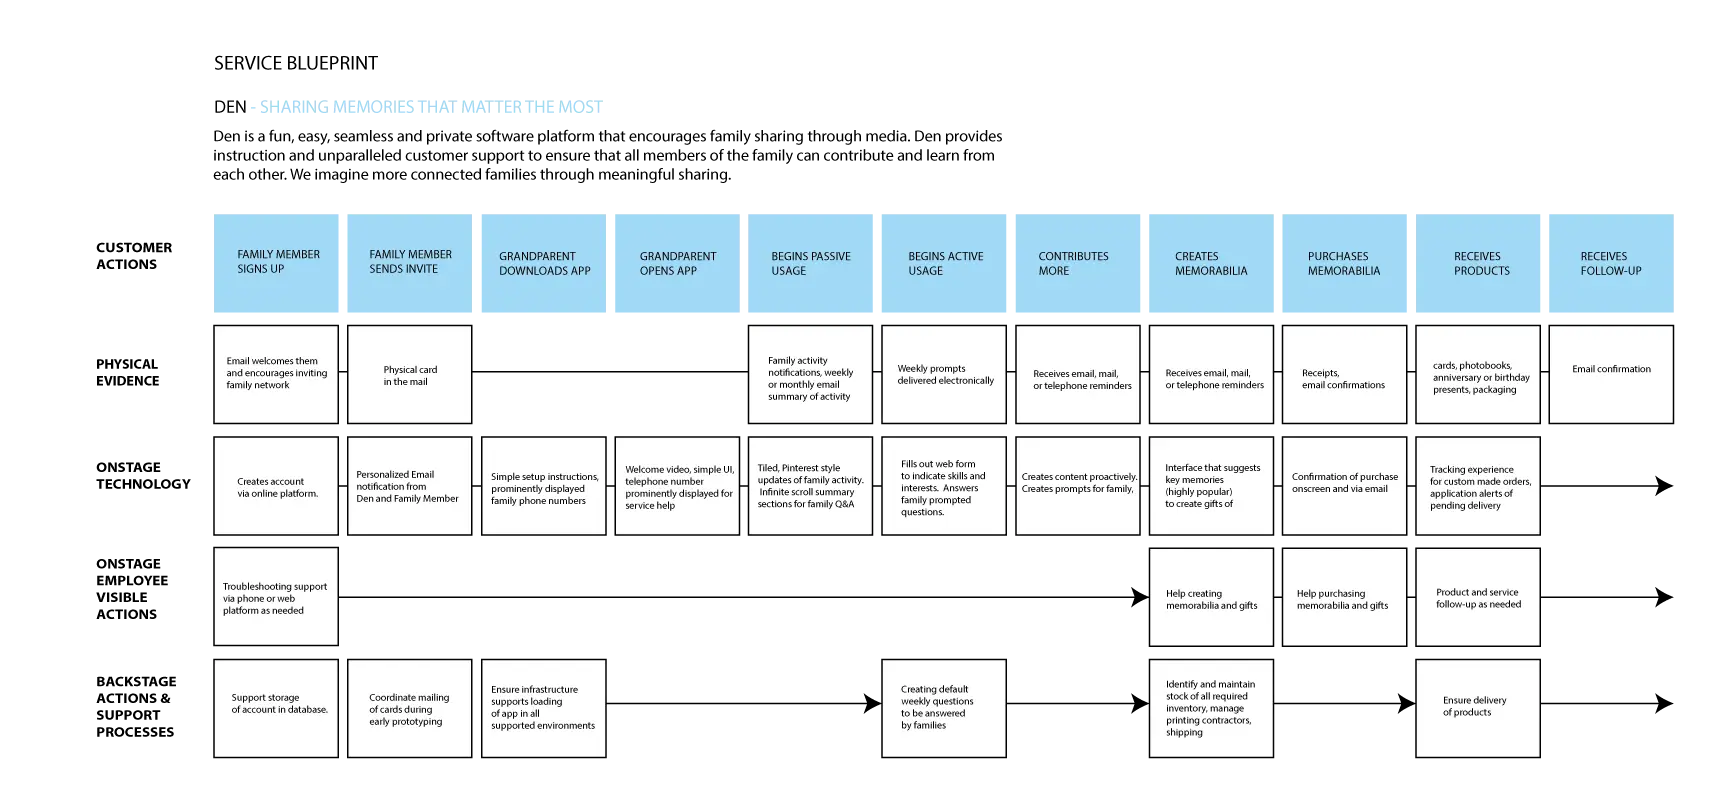
Service Blueprint Diagram -
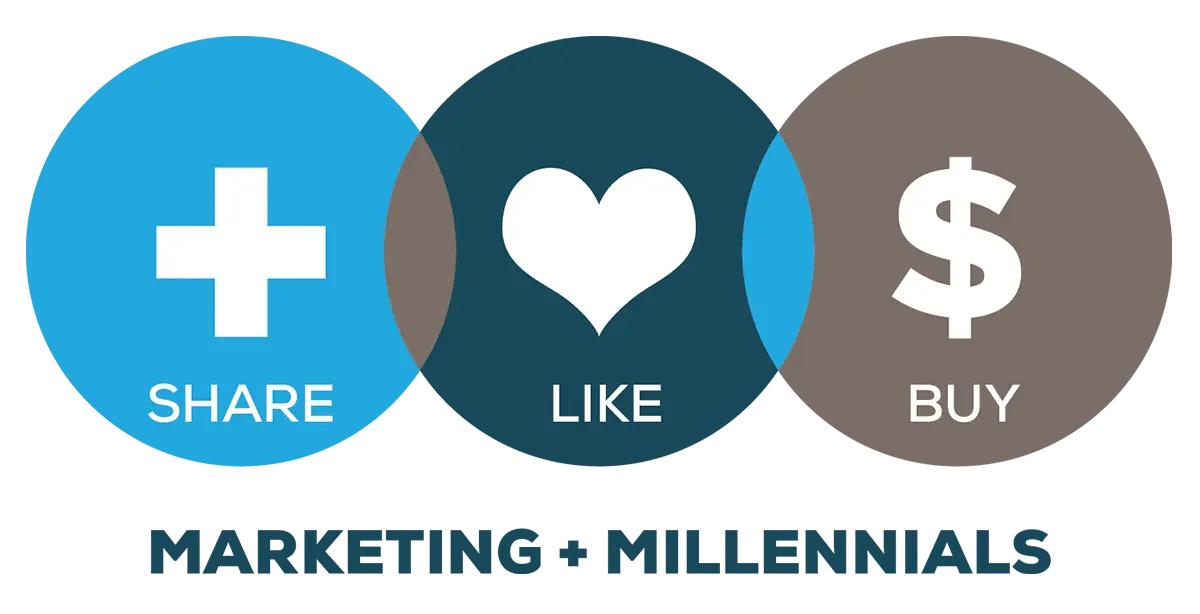
Marketing to Millennials