You Might Like
-

Various Devices Displaying Software -

Icon of KPI Dashboard with Graph and Person -

Infographic Pencil with Data Elements -

Business Icons Set for Digital Workflows -
Calculator and Chart Icon for Data Analysis -
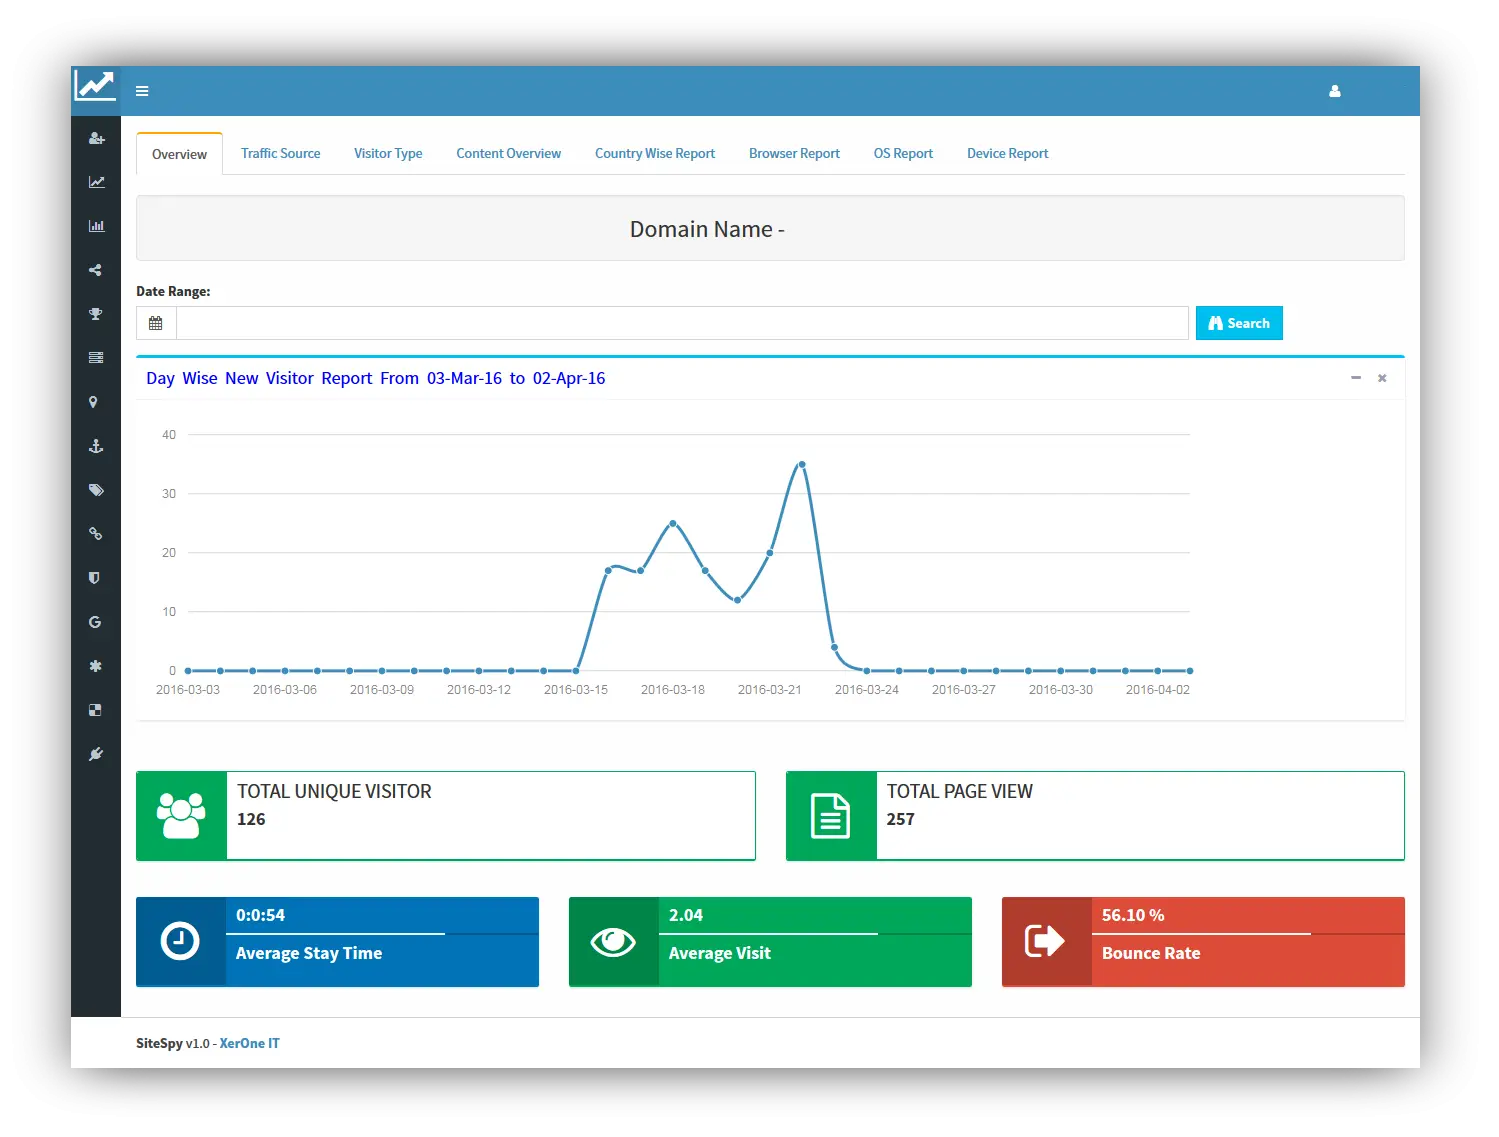
Computer Screen with Interface -

Mobile Data Analysis Graph -

Data Analysis Infographic Design -
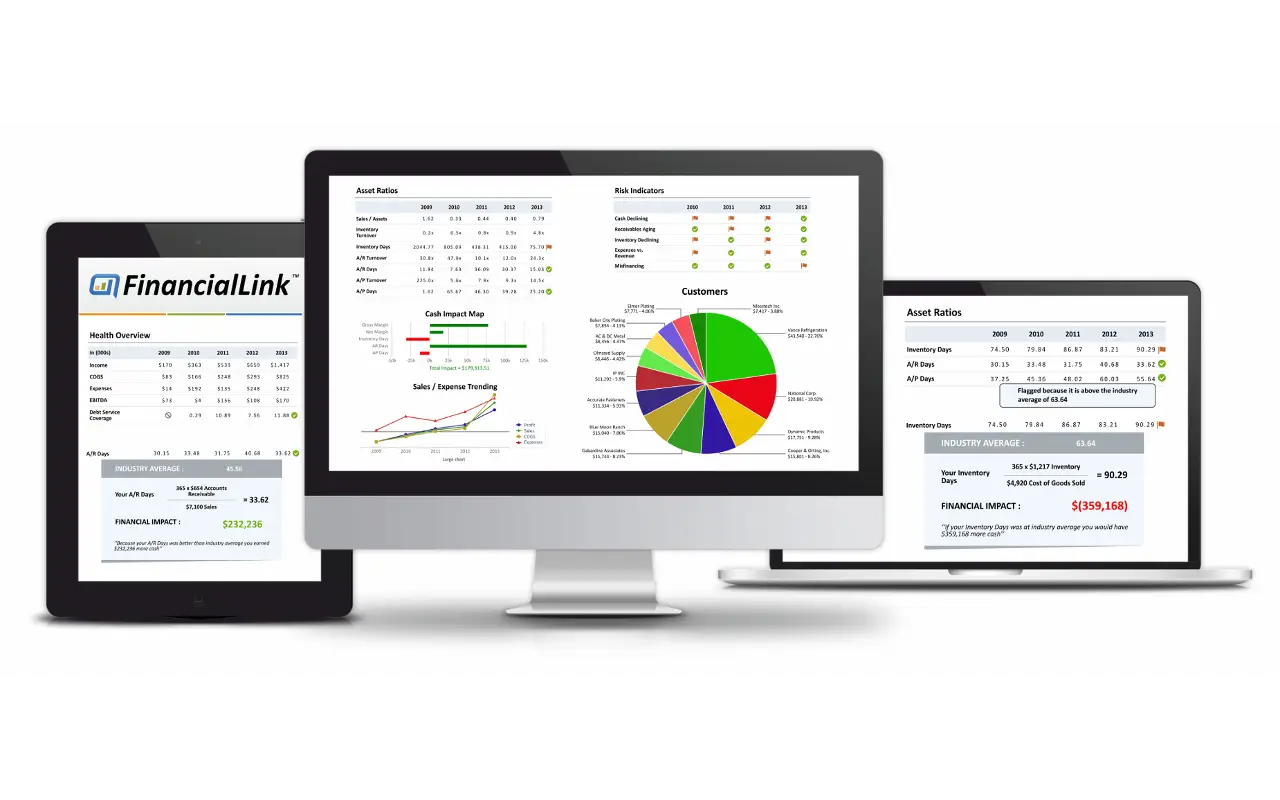
Financial Dashboard on Multiple Devices -
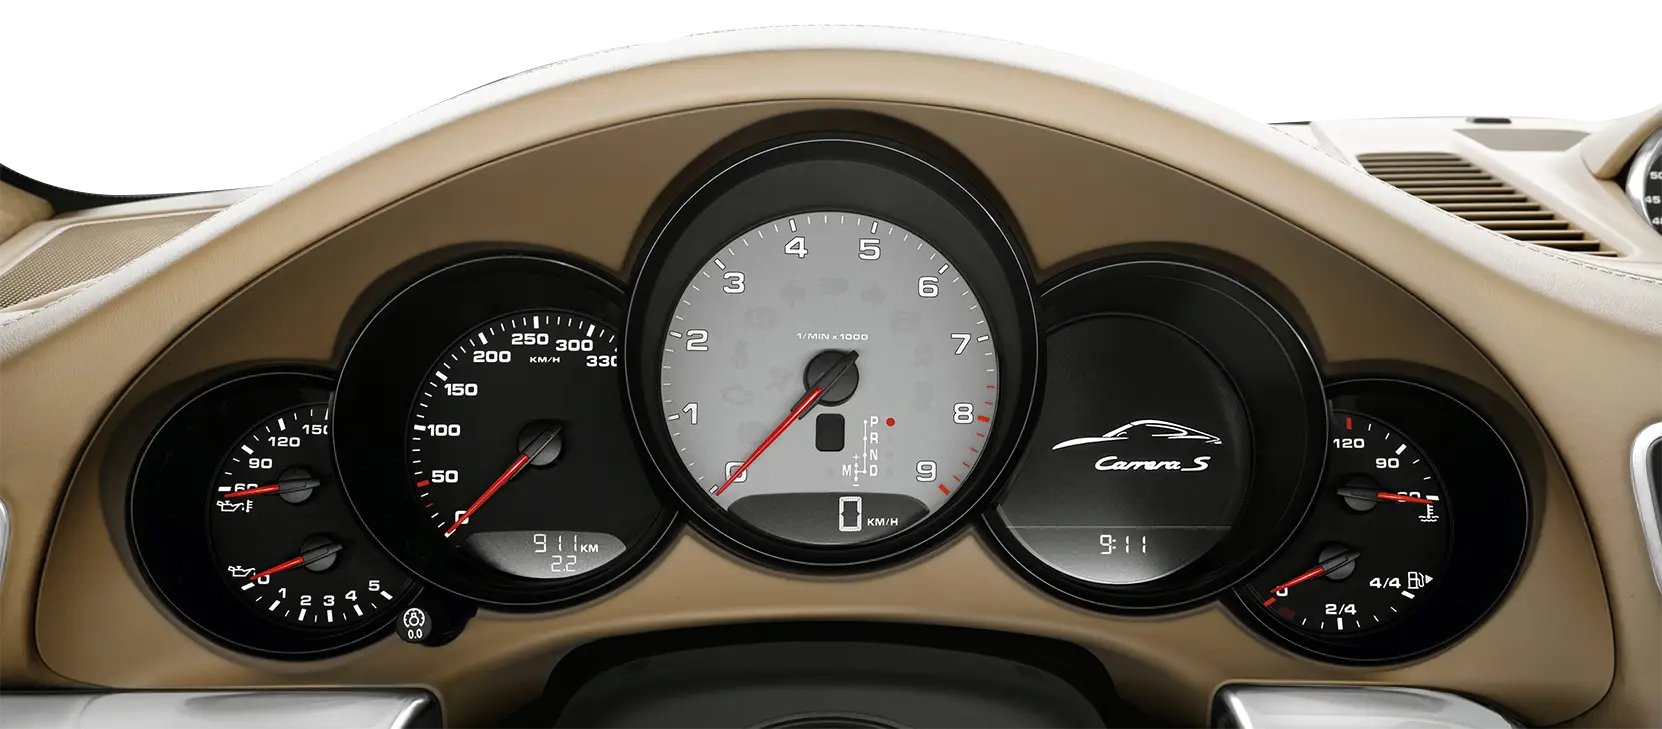
Car Dashboard with Gauges -

Data Analysis Icon -
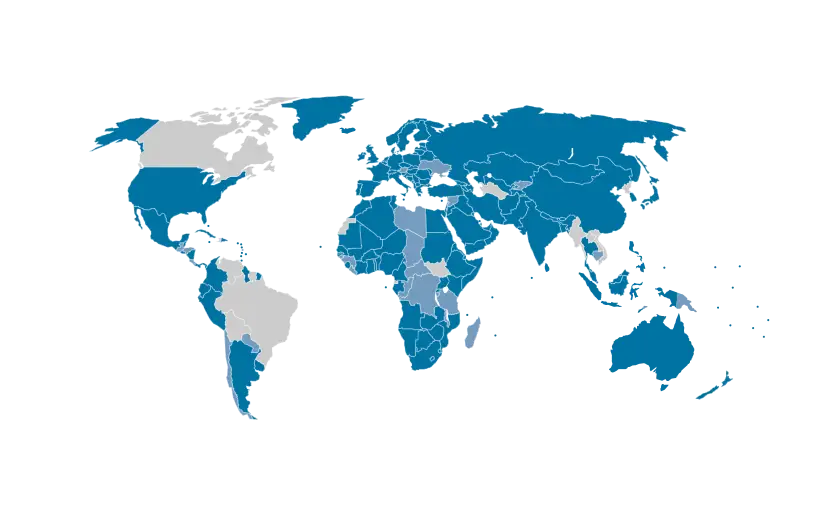
Blue and Gray Editable World Map -
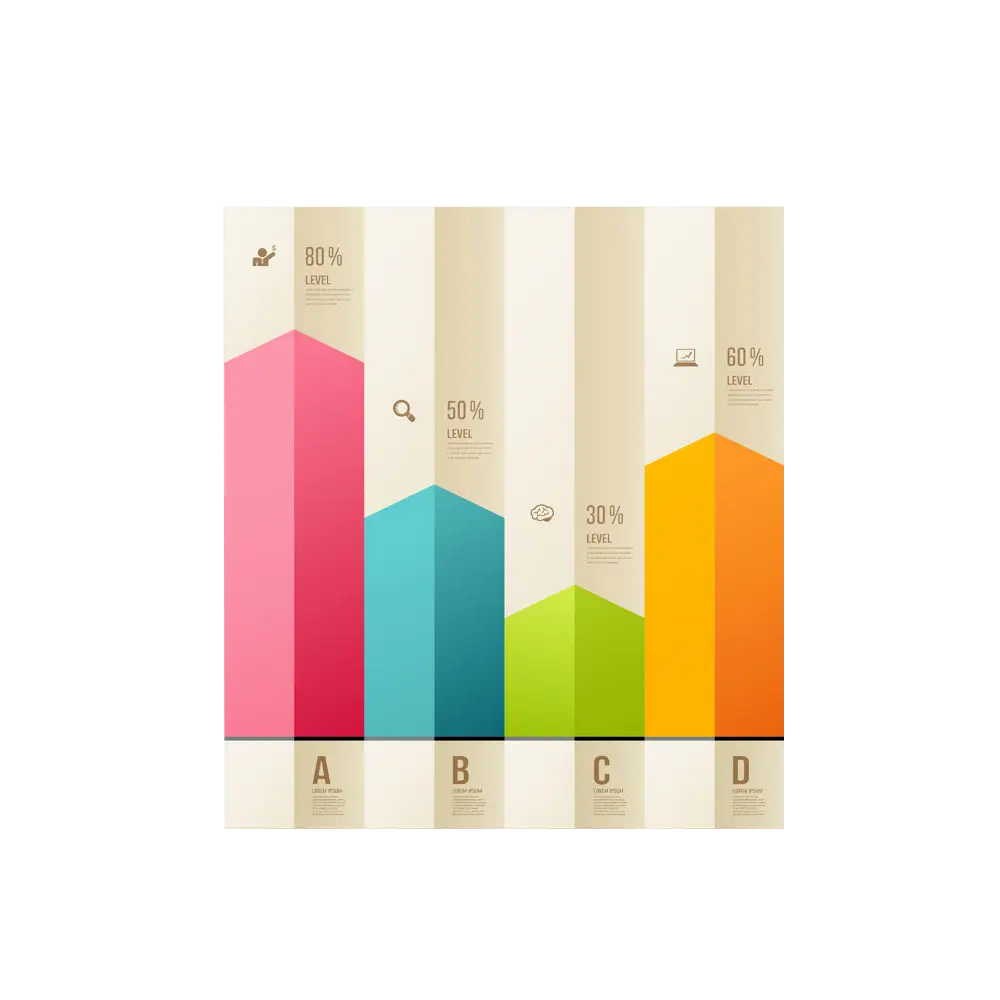
Colorful Bar Chart Infographic -
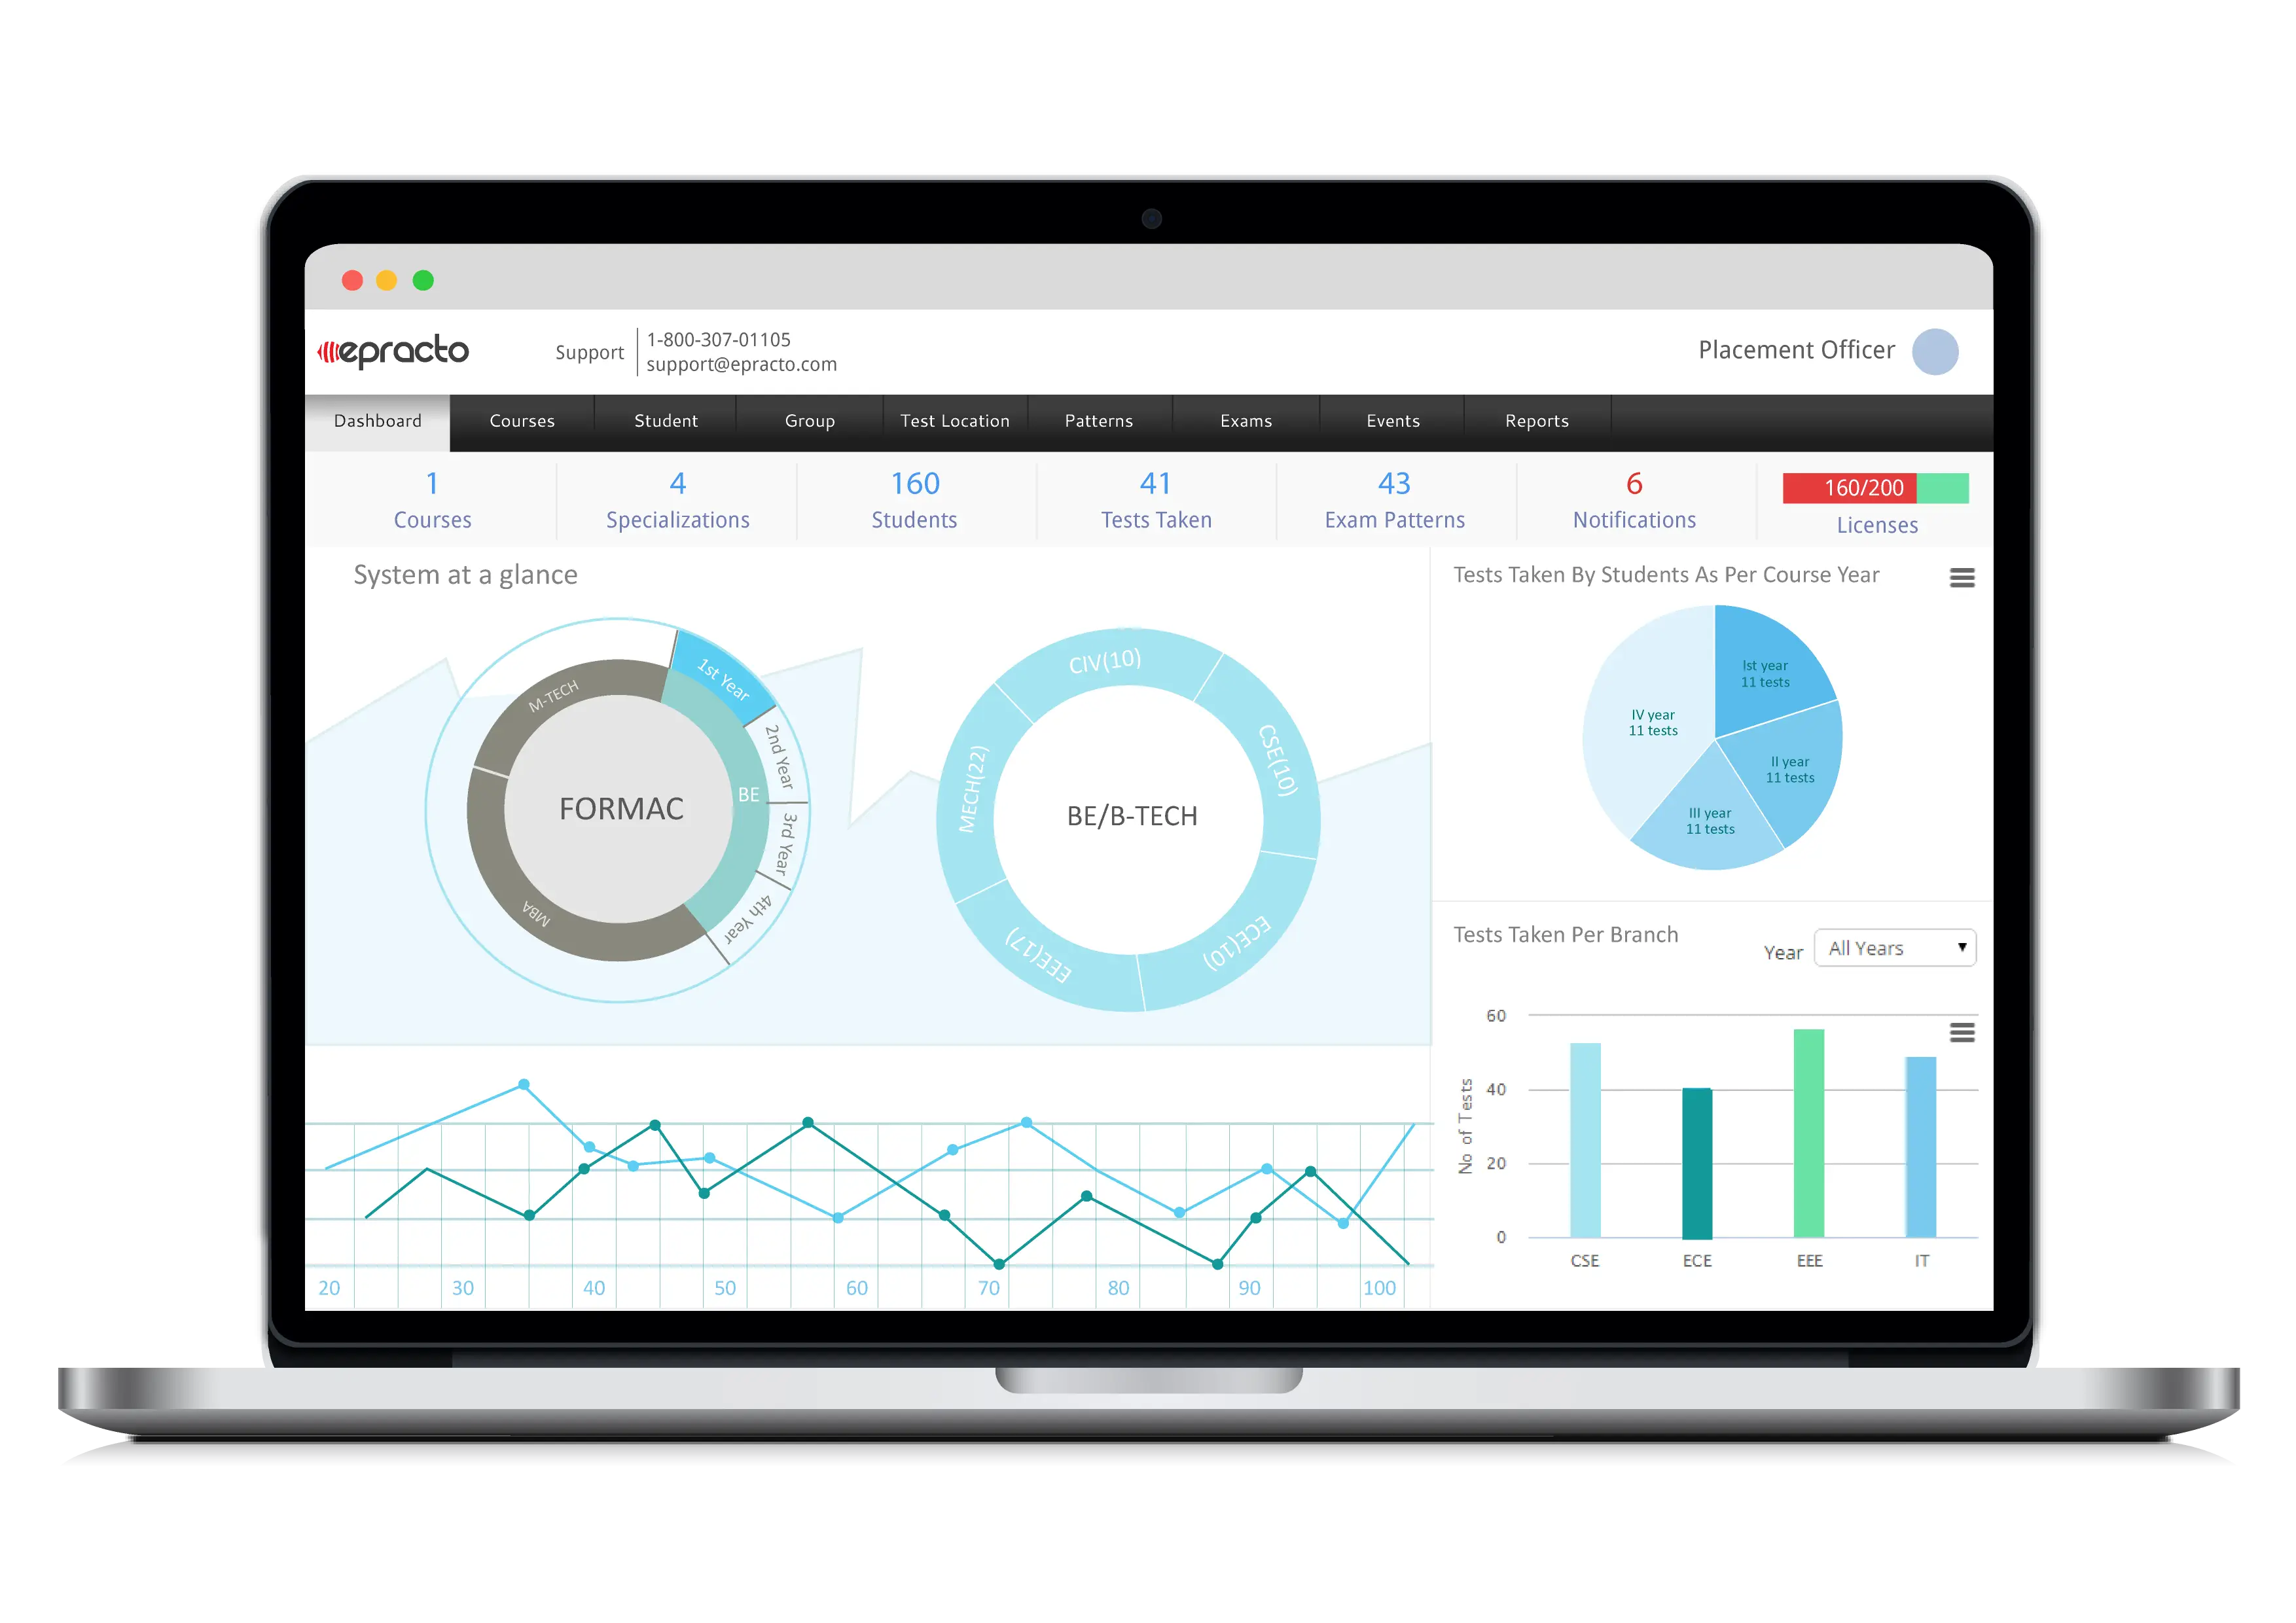
Data Charts on Laptop Screen Business Dashboard -

Analytics Visual Dashboard Illustration -
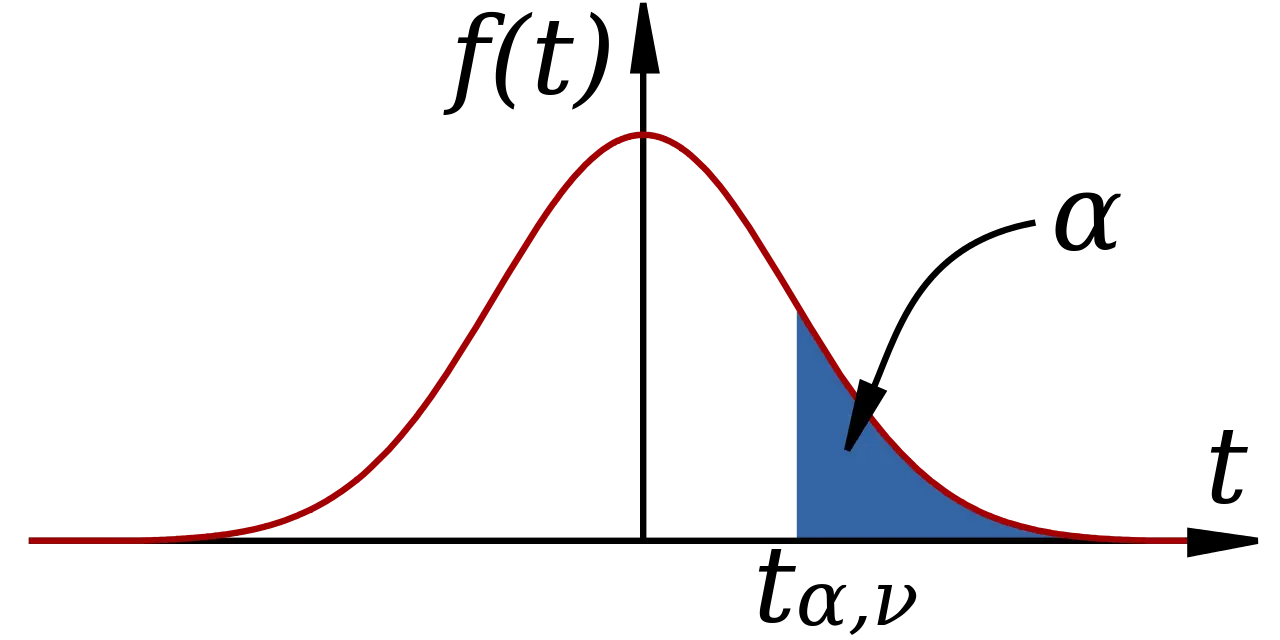
Mathematical Function Graph with Highlighted Area -

Hierarchical Structure Diagram -

Complex Network Structure with Interconnected Nodes -

Full Fuel Gauge Indicator -

Black Speedometer Icon for Vehicle Metrics -
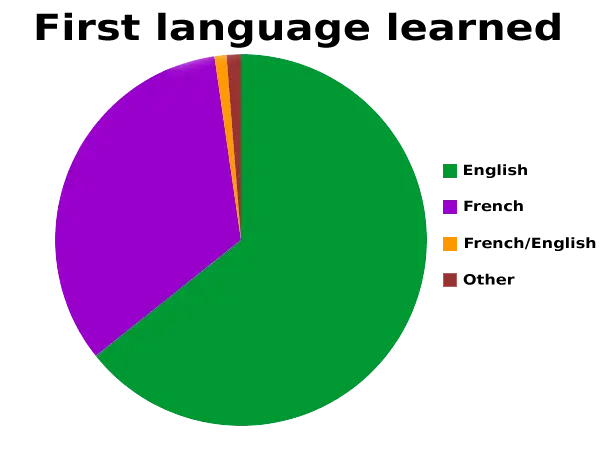
First Language Learned Pie Chart -

Simple Circular Progress Bar Design -

Graphic of Car Parts and Components -

44% Circular Progress Chart Icon -
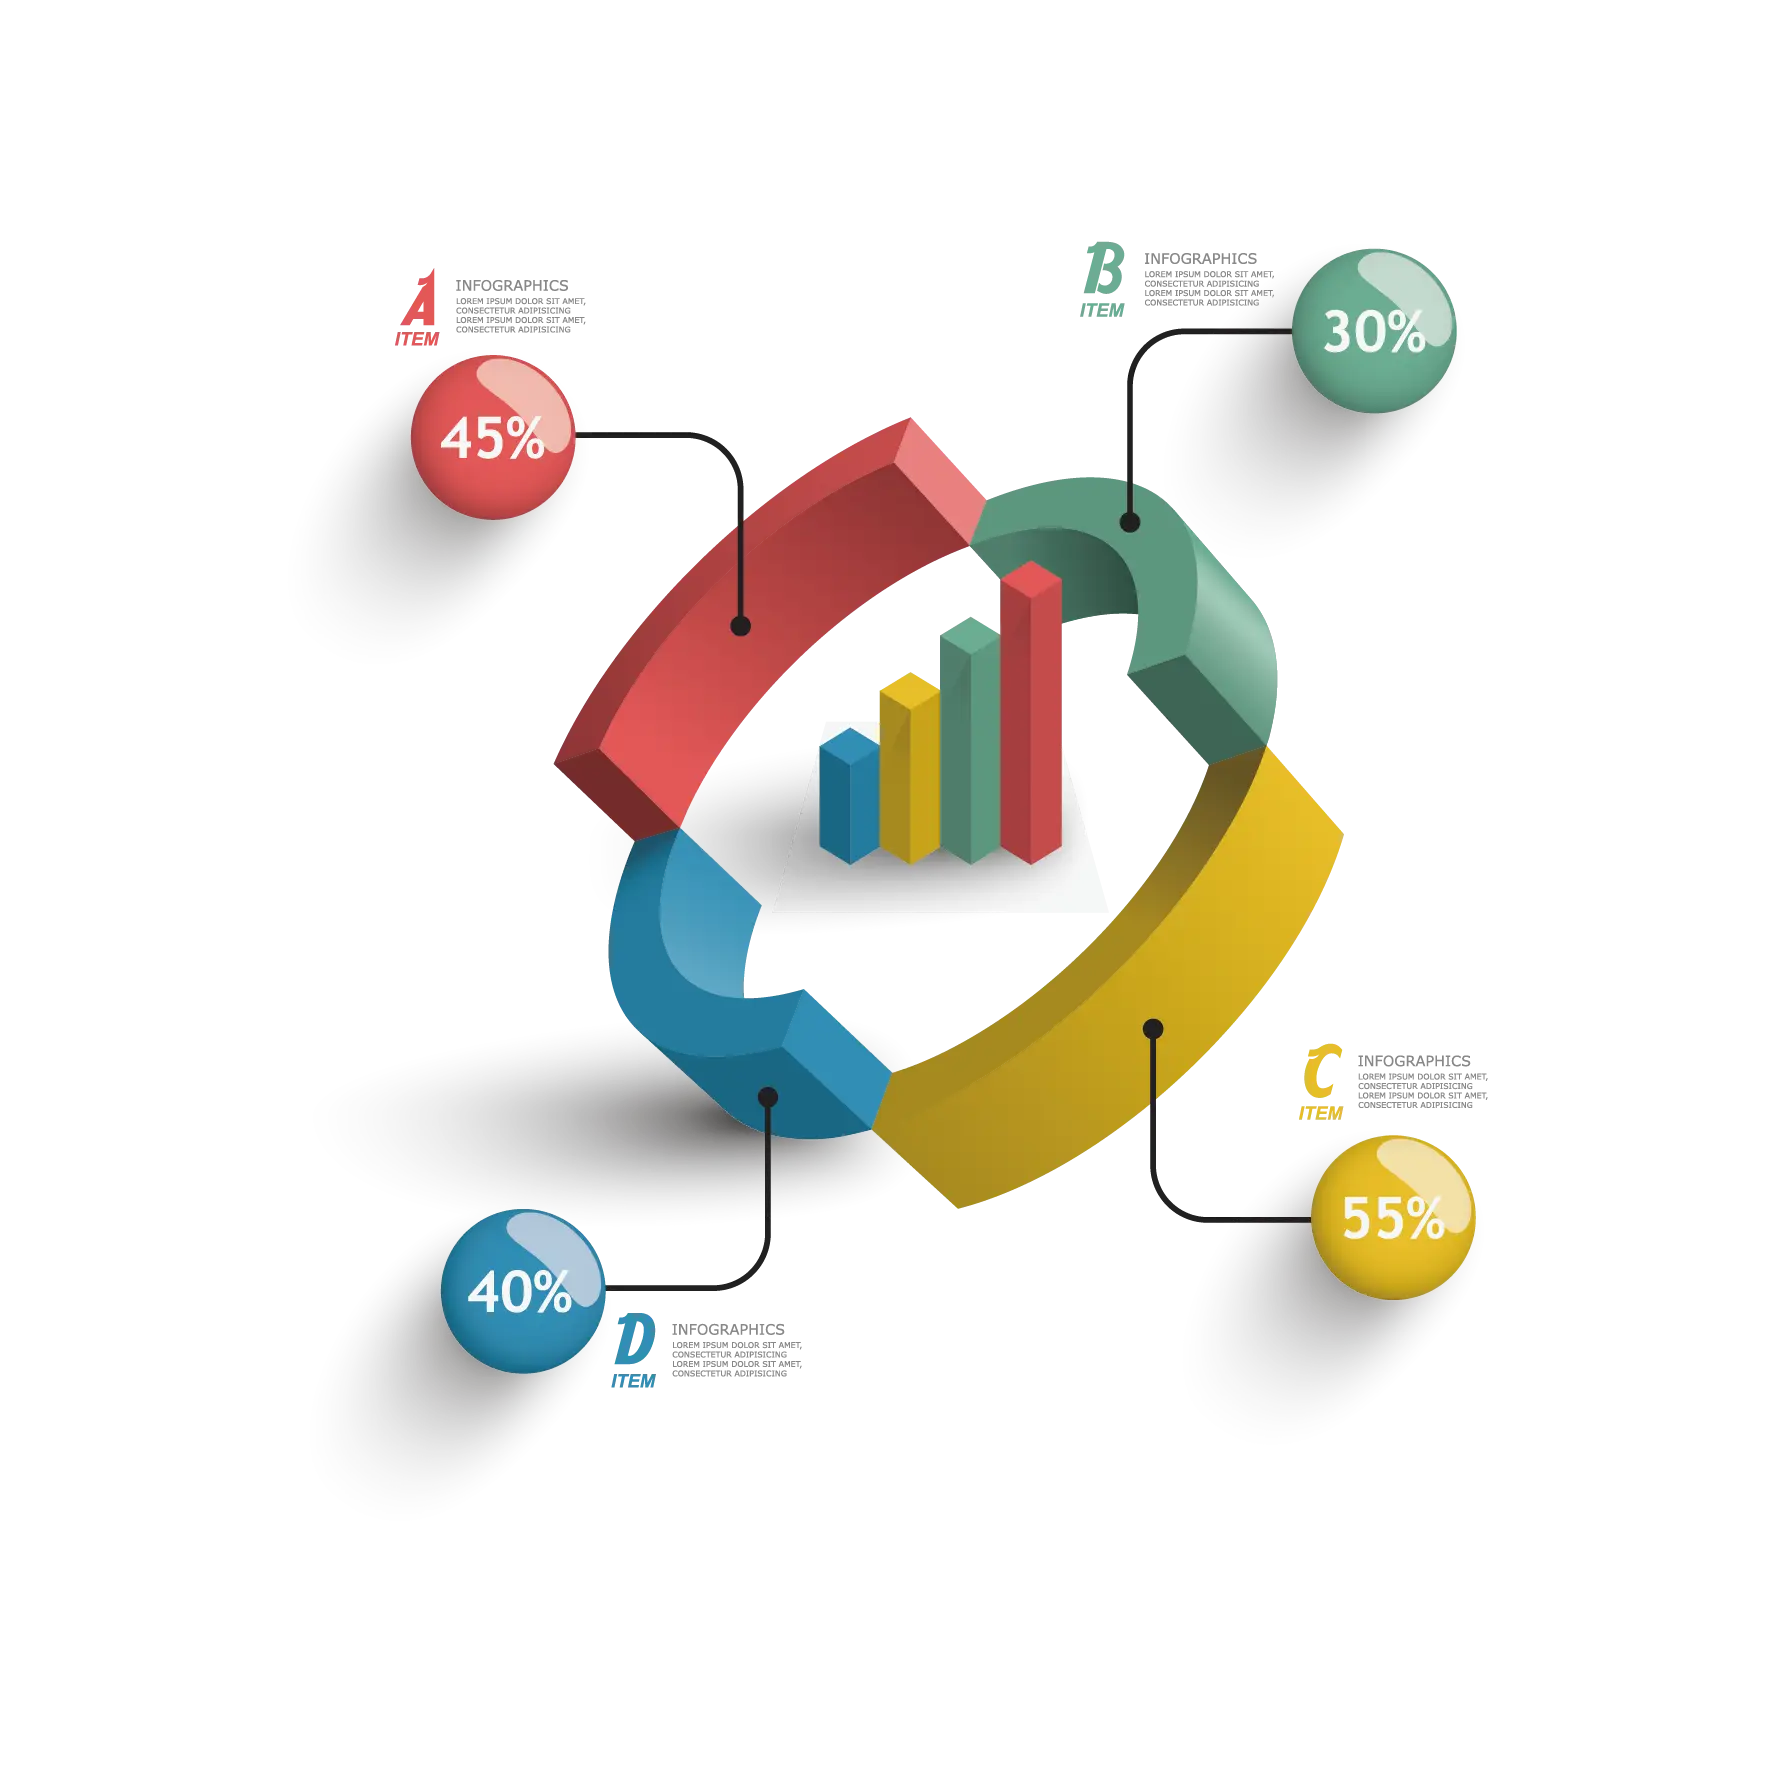
Colorful Infographic Chart -

Simple Pie Chart -

Yellow Fog Light Symbol -
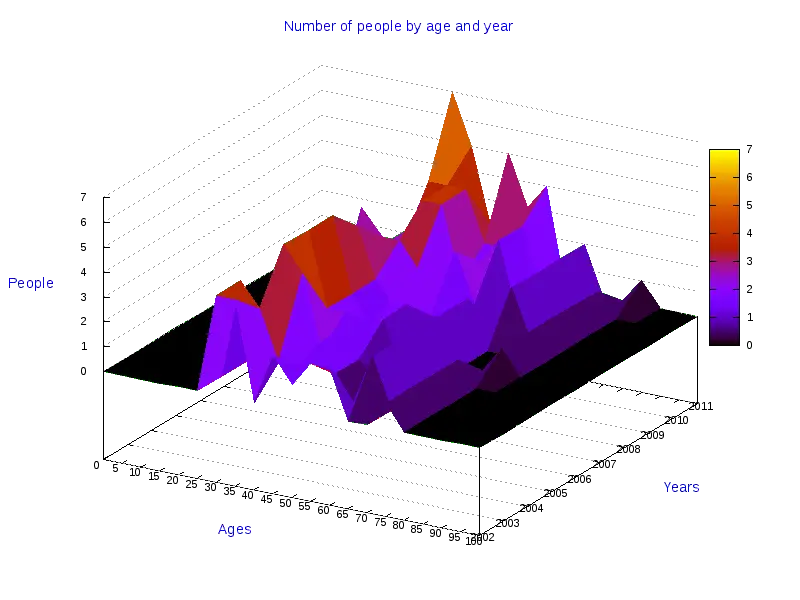
3D Colorful Graph Chart for Data Representation -

Woman Presenting Data -
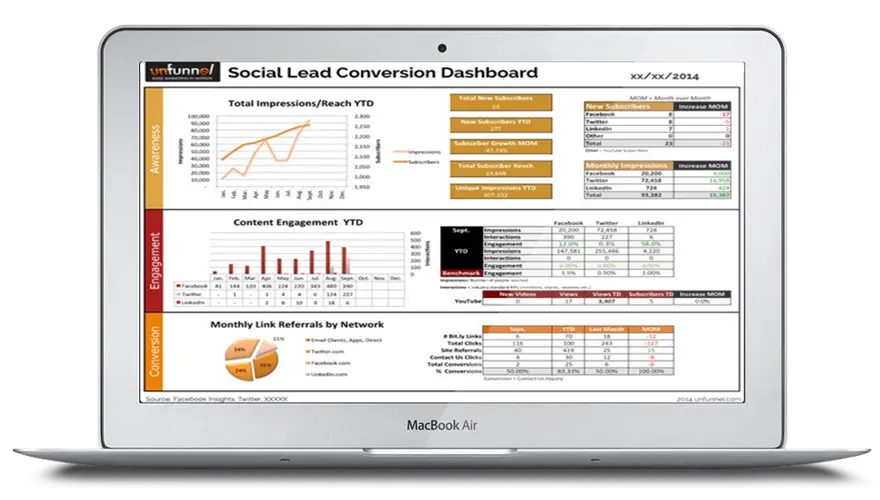
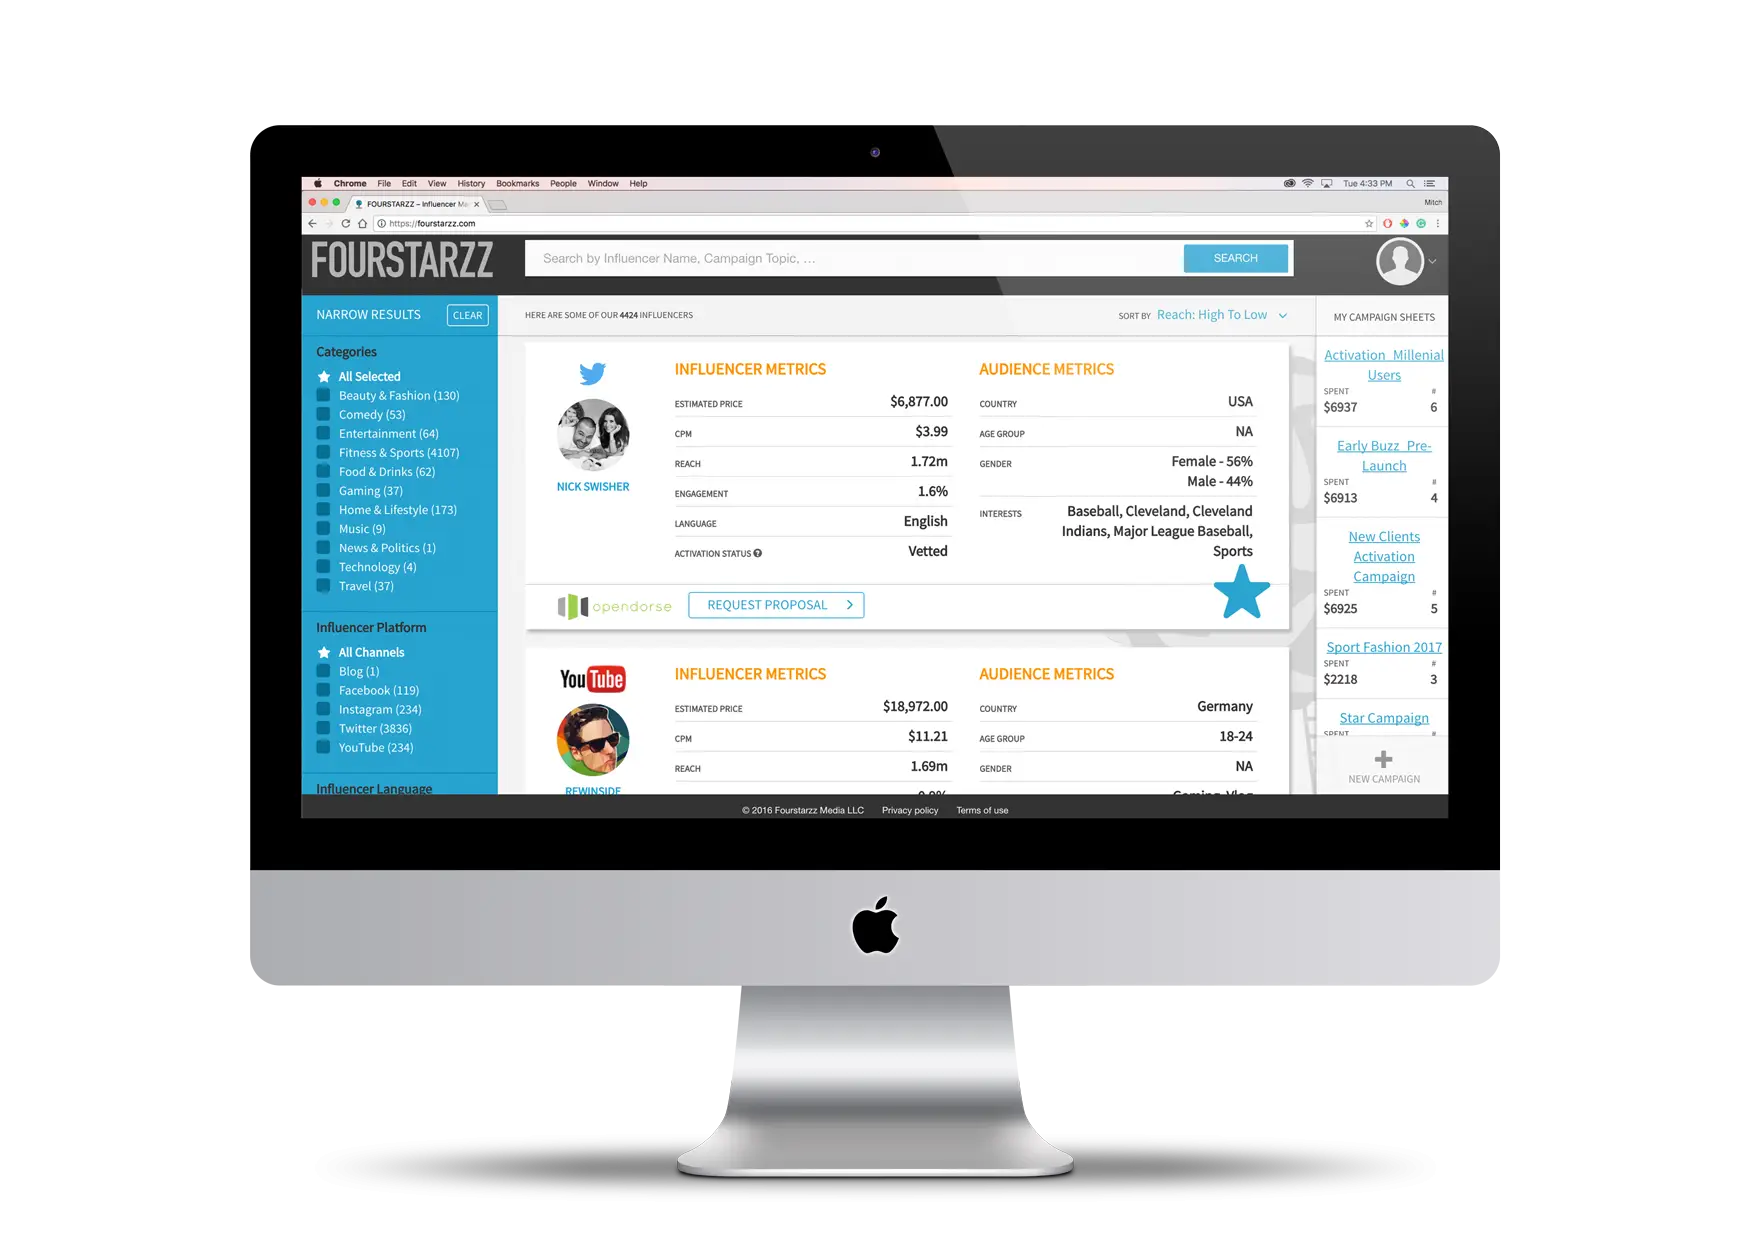
Social Lead Conversion Dashboard on Laptop