Free Analytics Cliparts and Illustrations - Page 3
Free 188 analytics cliparts & illustrations for your personalized works, such as minimalistic line graph for data representation, analytics graph on laptop screen, laptop with statistics dashboard displayed, social media growth chart with icons and many more.
-

Minimalistic Line Graph for Data Representation -

Analytics Graph on Laptop Screen -
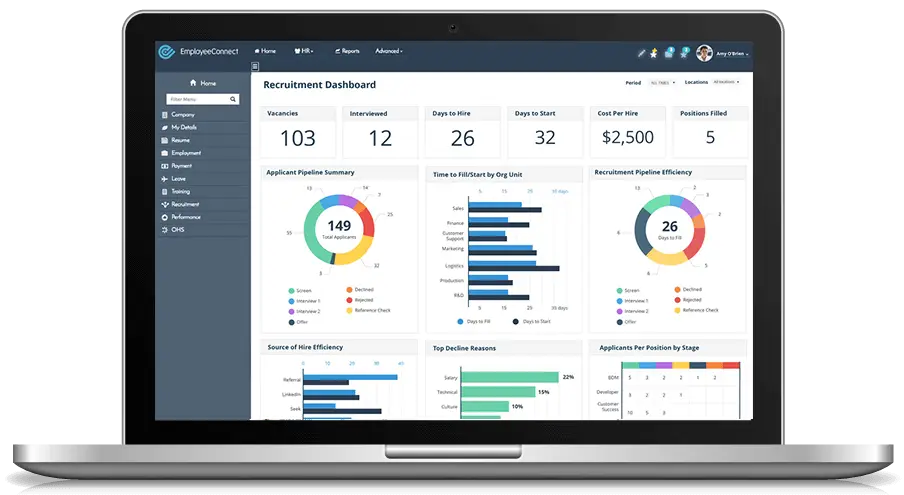
Laptop with Statistics Dashboard Displayed -

Social Media Growth Chart with Icons -

Colorful Marketing Funnel Illustration for Digital Strategy -

Digital Workflow Visualization for Business -

Business Data Graph -

Apache Spark Logo for Big Data Application -

Google Analytics Logo -

Data science icon with magnifier -

Cartoon Business Presentation Setup -

Clipboard and Calculator Icons -

Blue Customer Relationship Management Icon -
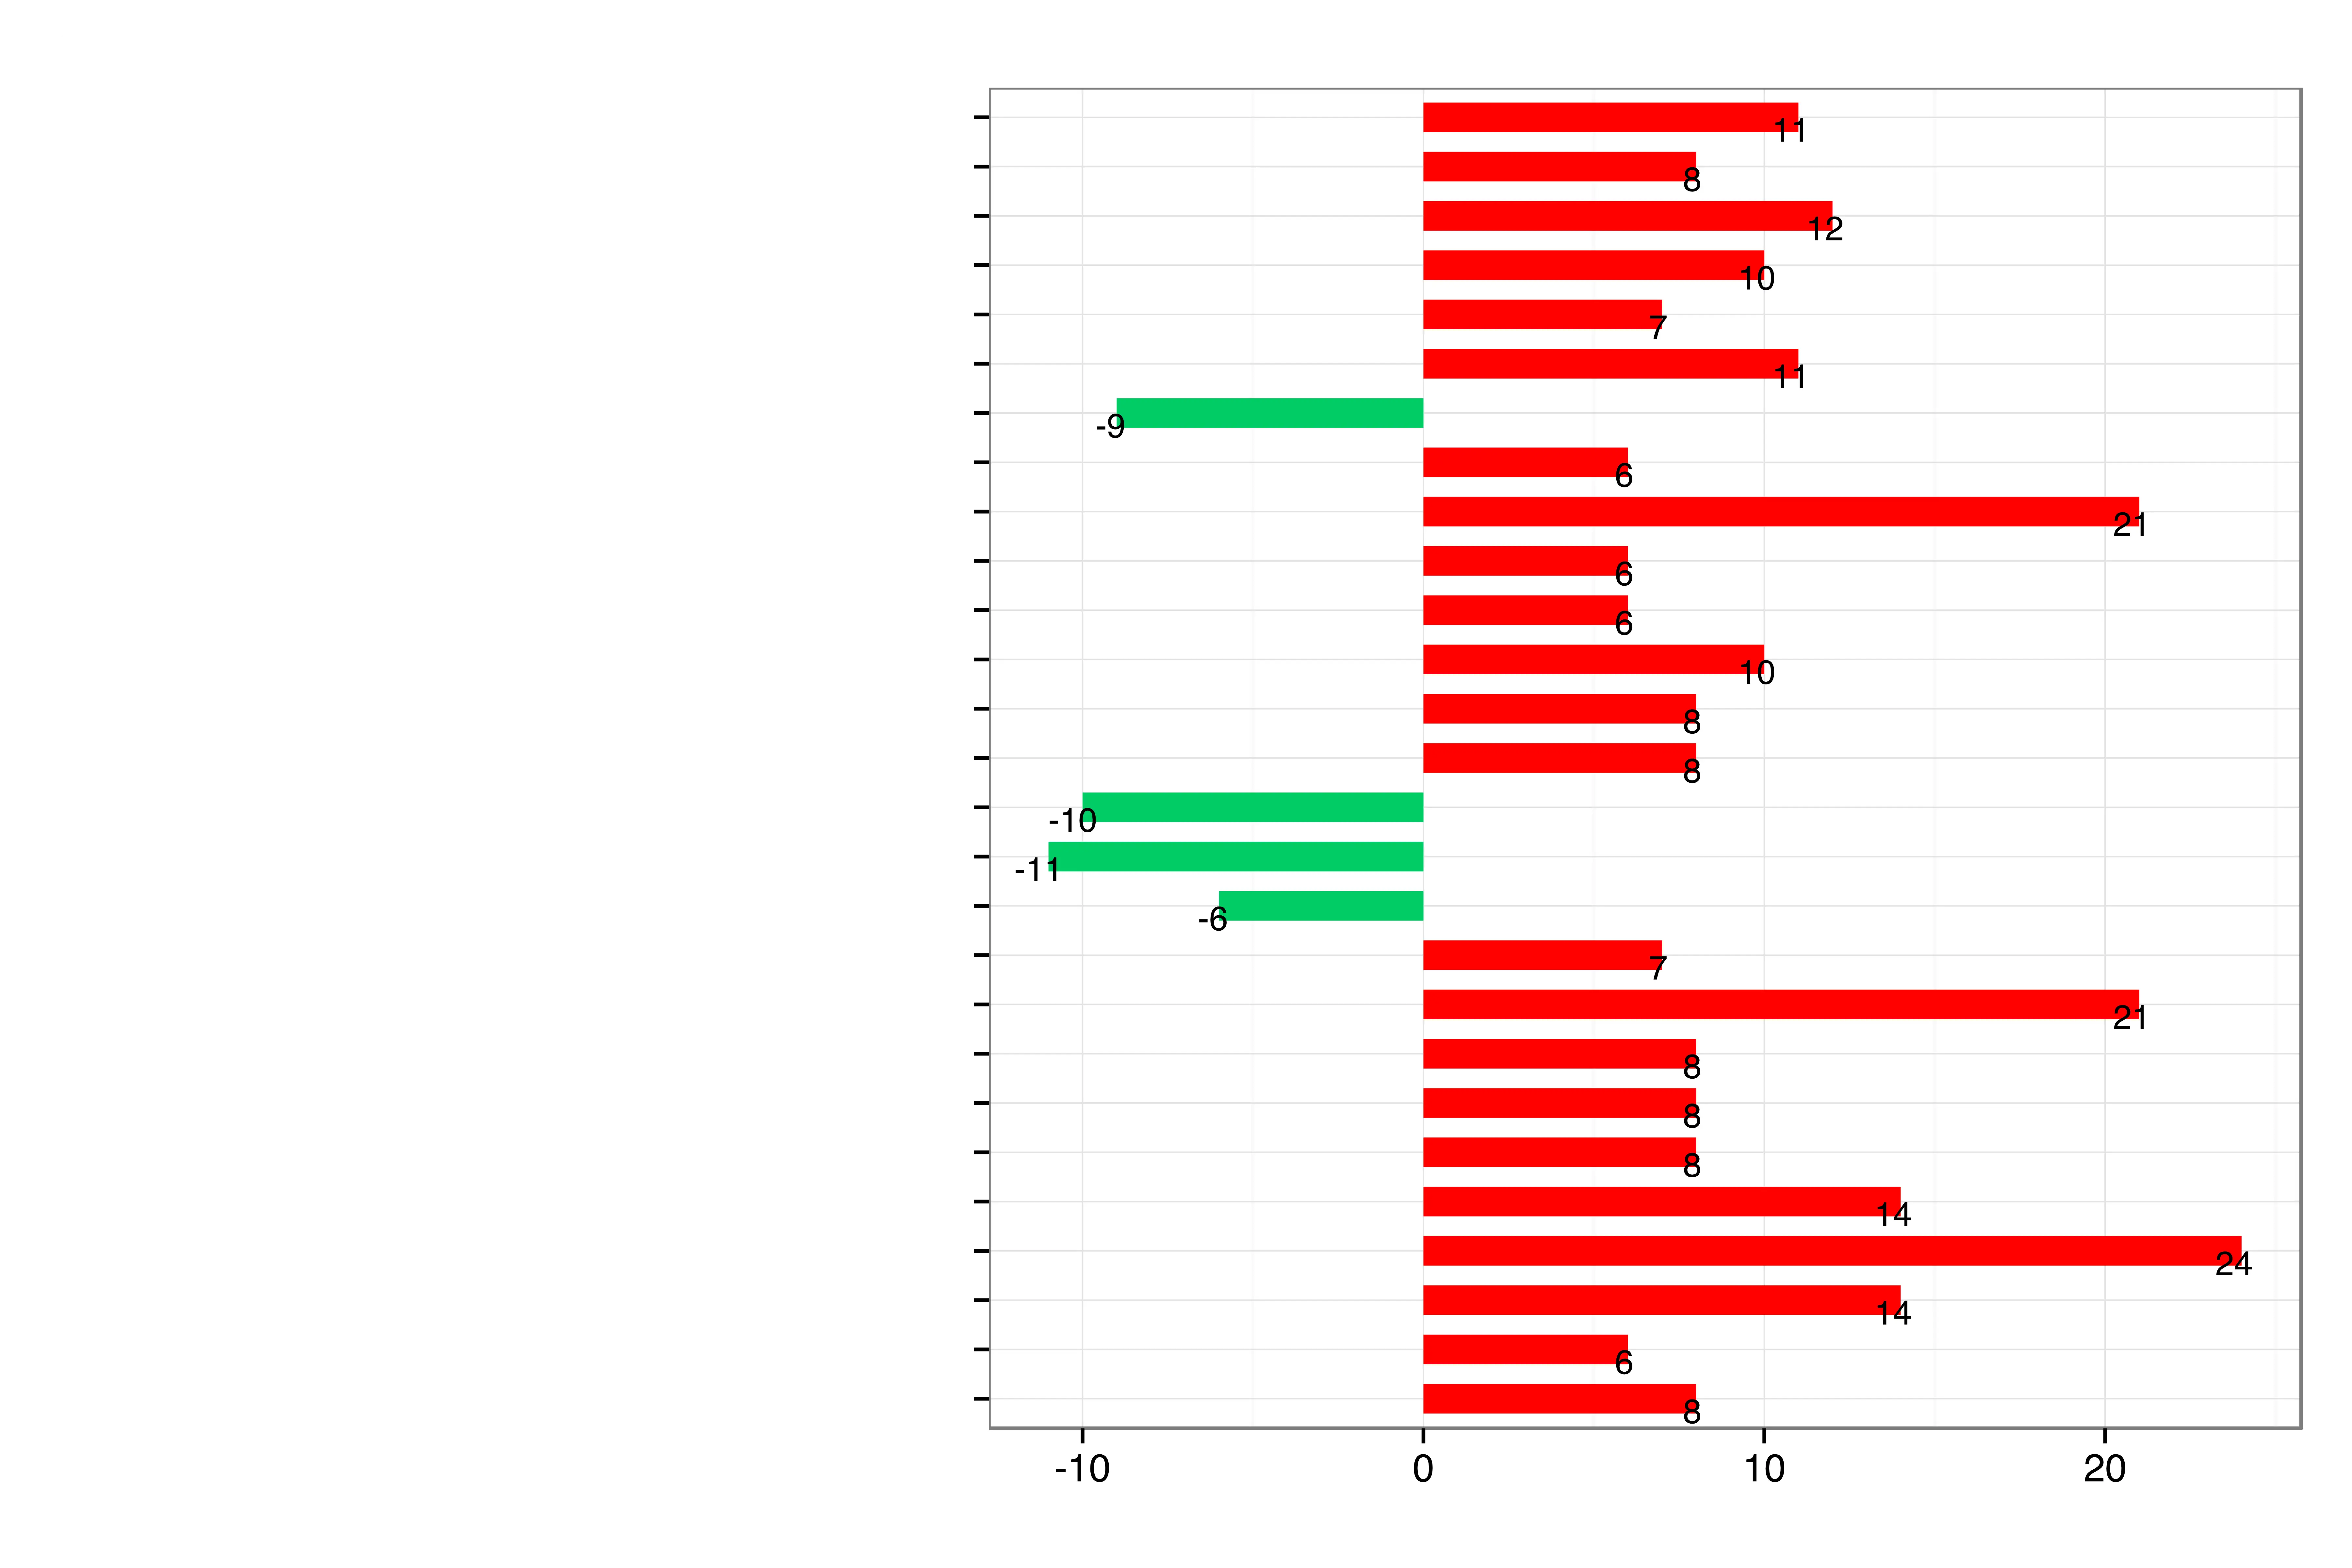
Red and Green Bar Chart -

Businesswoman Presenting Data Analytics Illustration -

Marketing Department Infographic -

Set of Computer and Technology Icons -

Data Analysis Illustration -

LatentView Analytics Logo -
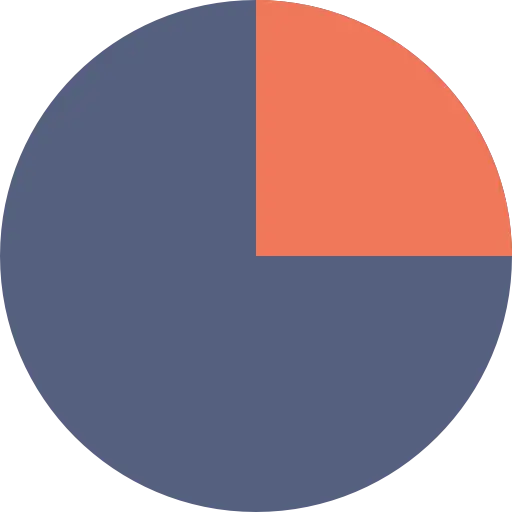
Colorful Pie Chart Illustration for Data Visualization -

Analytics Visualization Icon -
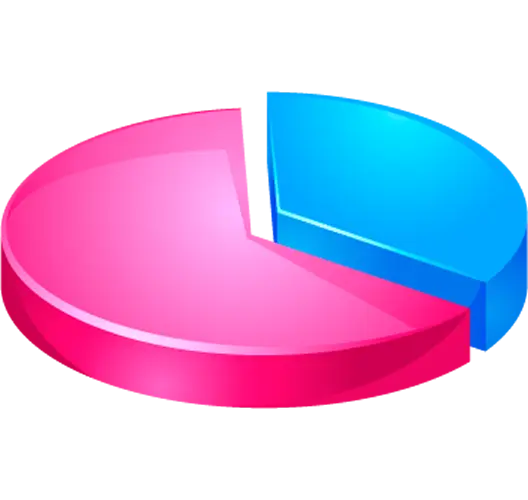
Pie Chart with Highlighted Segment for Analytics -
Laptop Displaying Business Graphs -
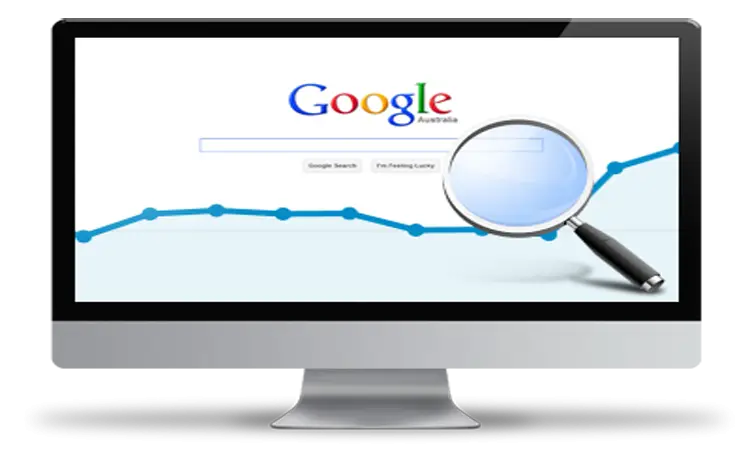
Computer Screen with Search Engine -

Business Icons in Flat Design -

Blue Graph Device Icon -

Growth Chart Showing Progress -
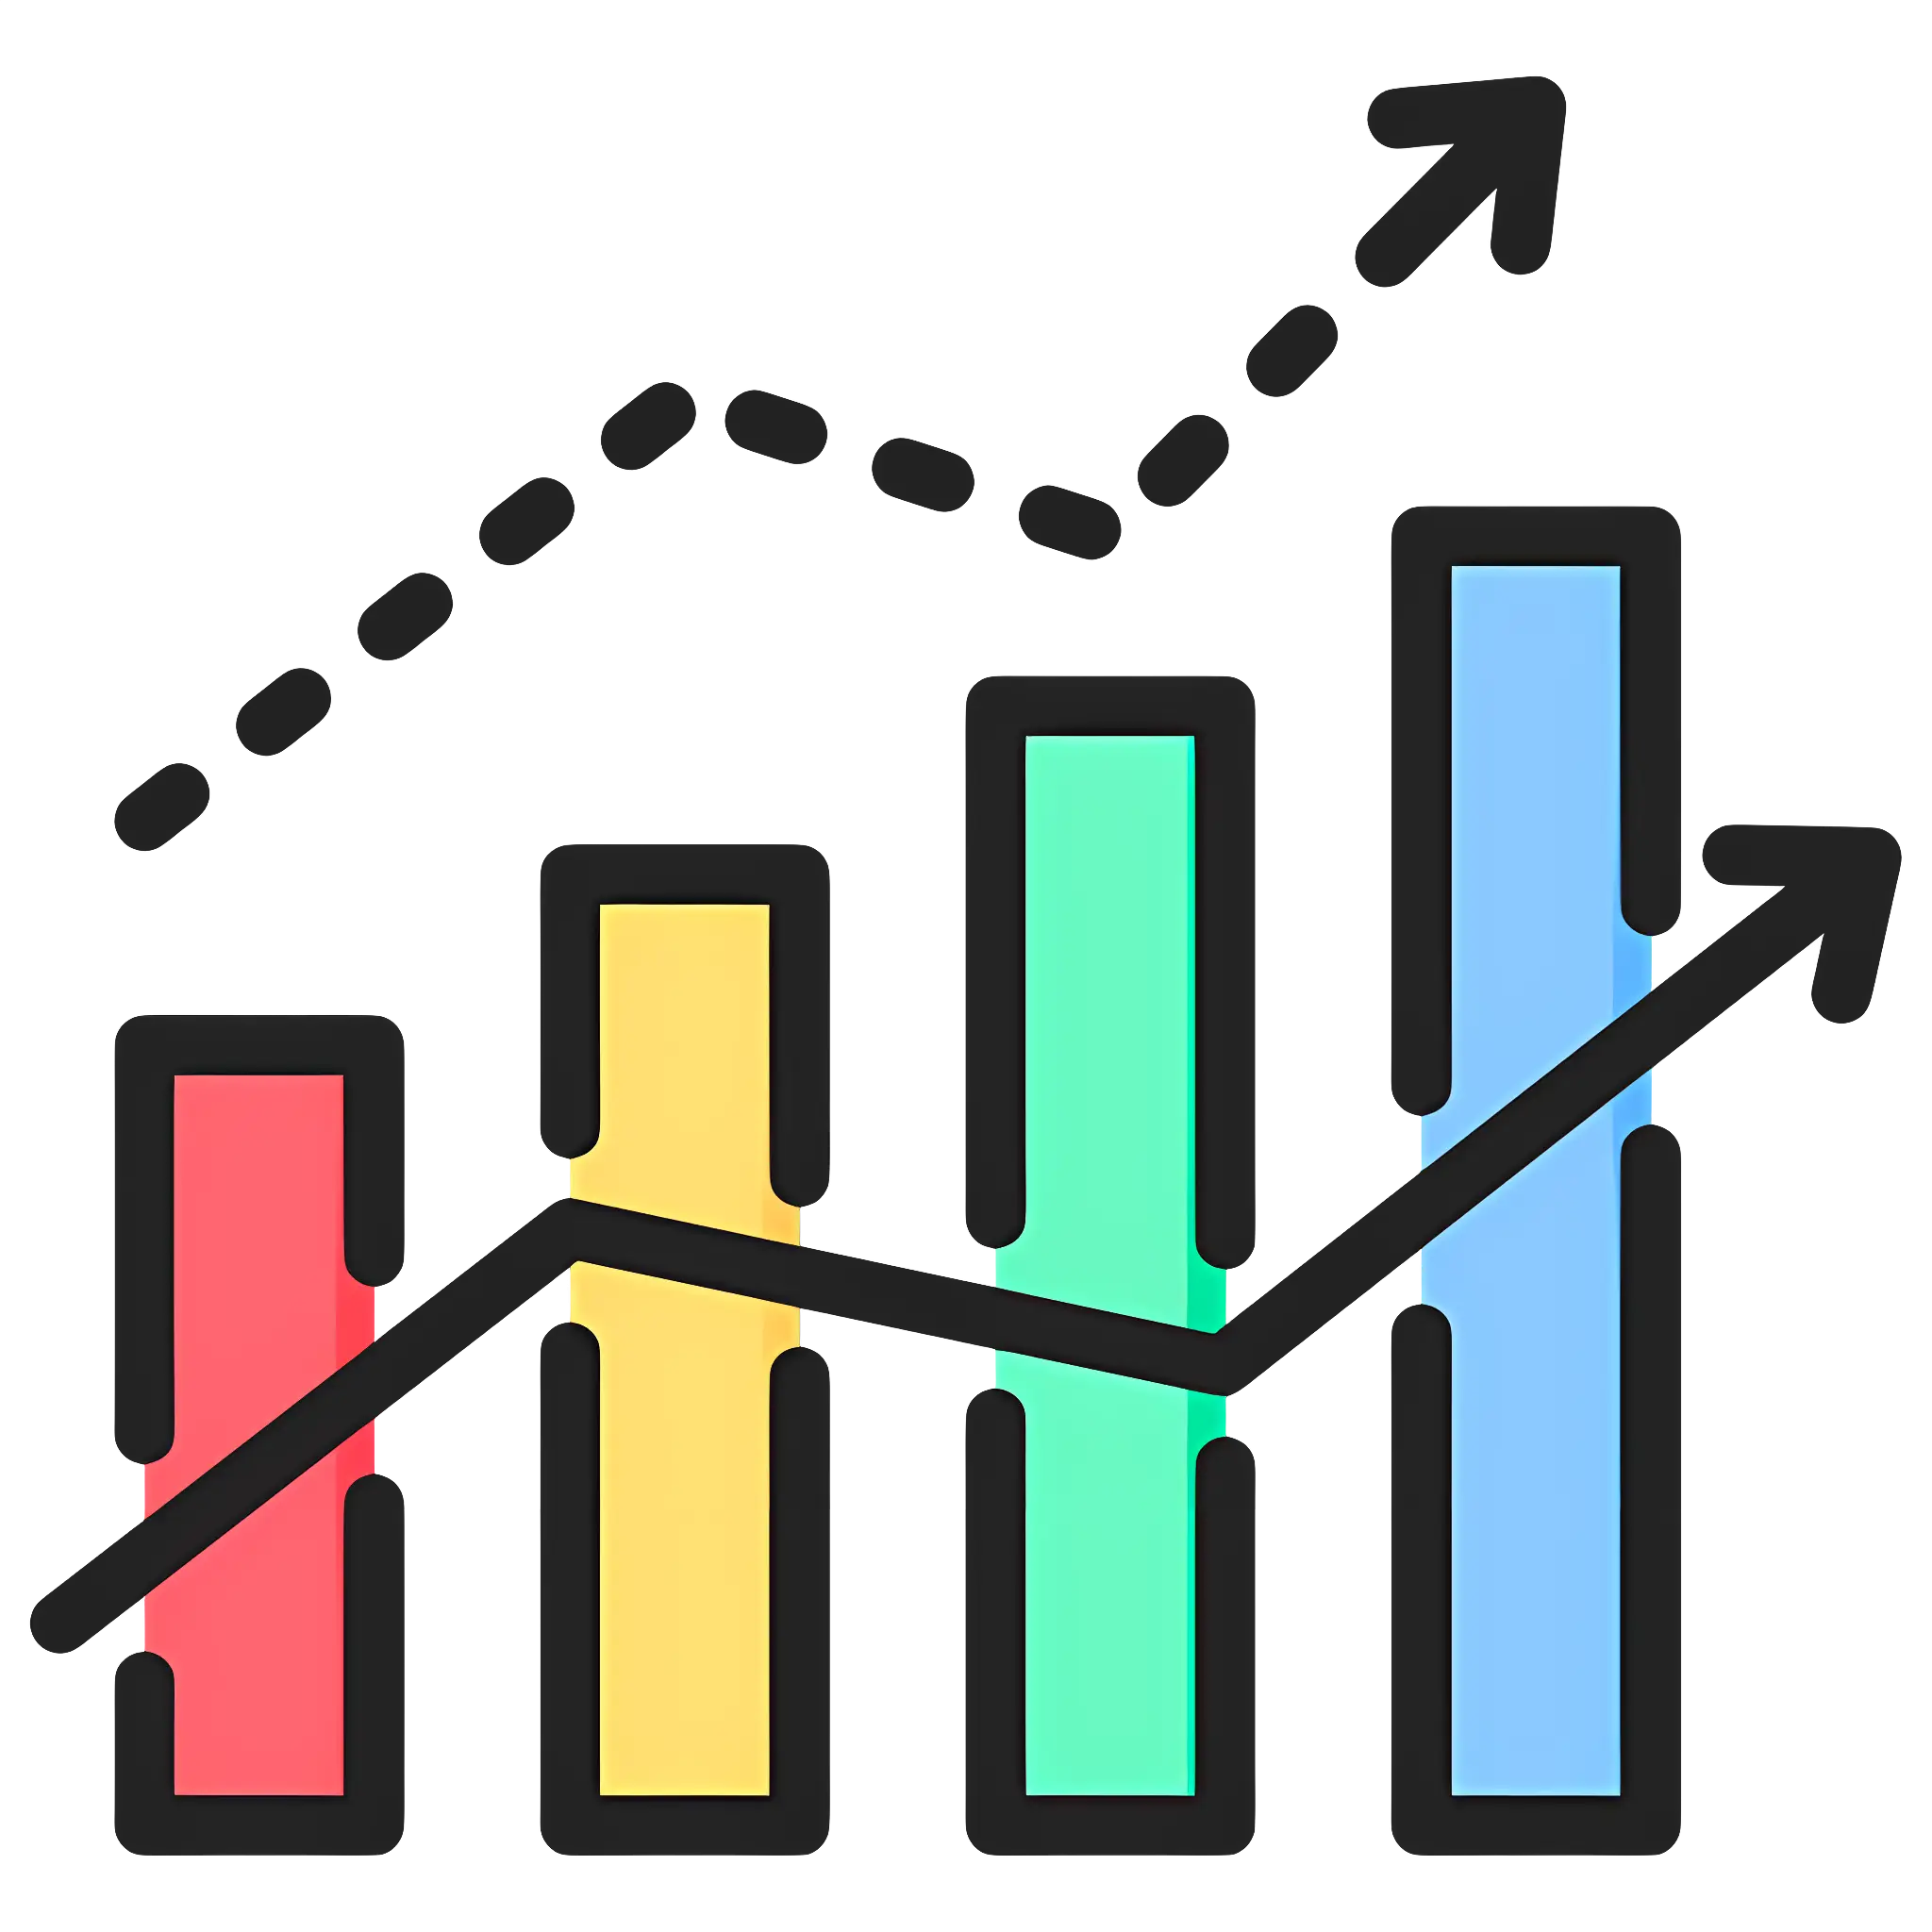
Bar and Line Chart for Data Analysis -
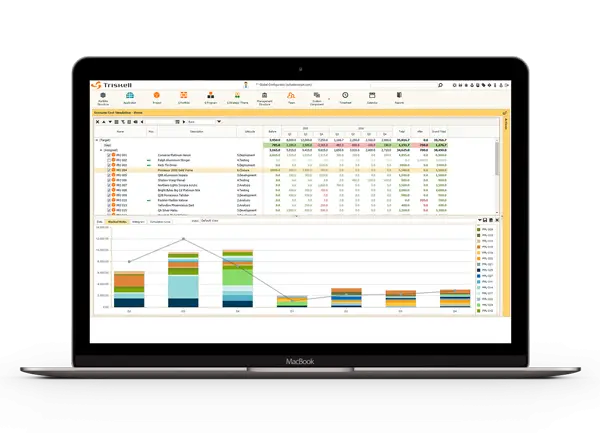
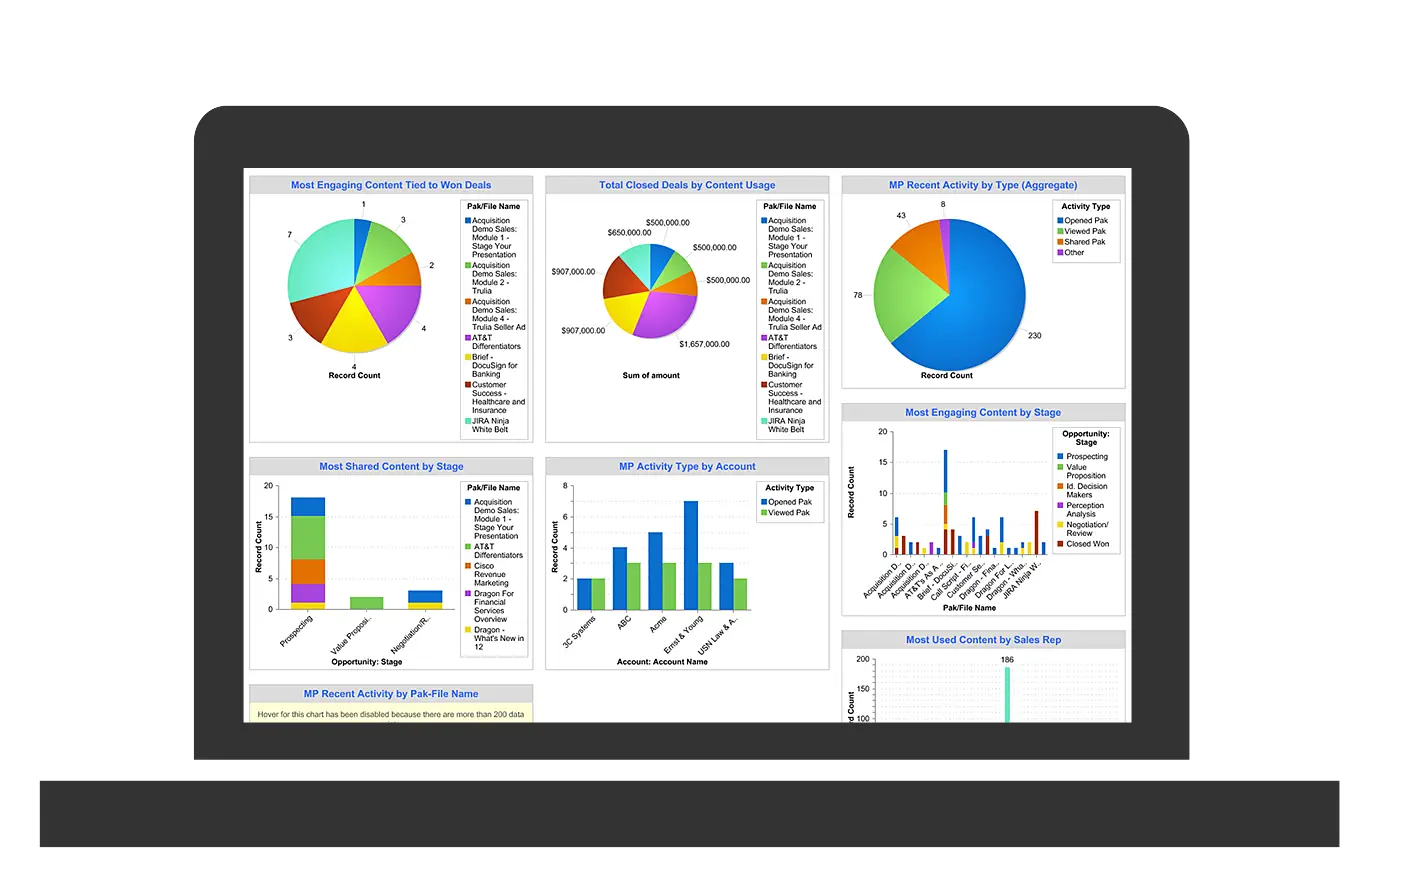
Data Analytics Dashboard on Monitor -

Flat Design Digital App Vector Icons -

Laptop Illustration for Digital Marketing Concept -

Business Network with Graph and Gear -

Business and Analytics Icons for Strategic Planning -
Laptop Displaying Data Charts -

Bar Chart Icon for Data Visualization -

Orange Bar Analytics Icon -

Blue Graph Icon on Monitor -
Computer Monitor Displaying Dashboard -

Financial Report with Hand in Flat Style -

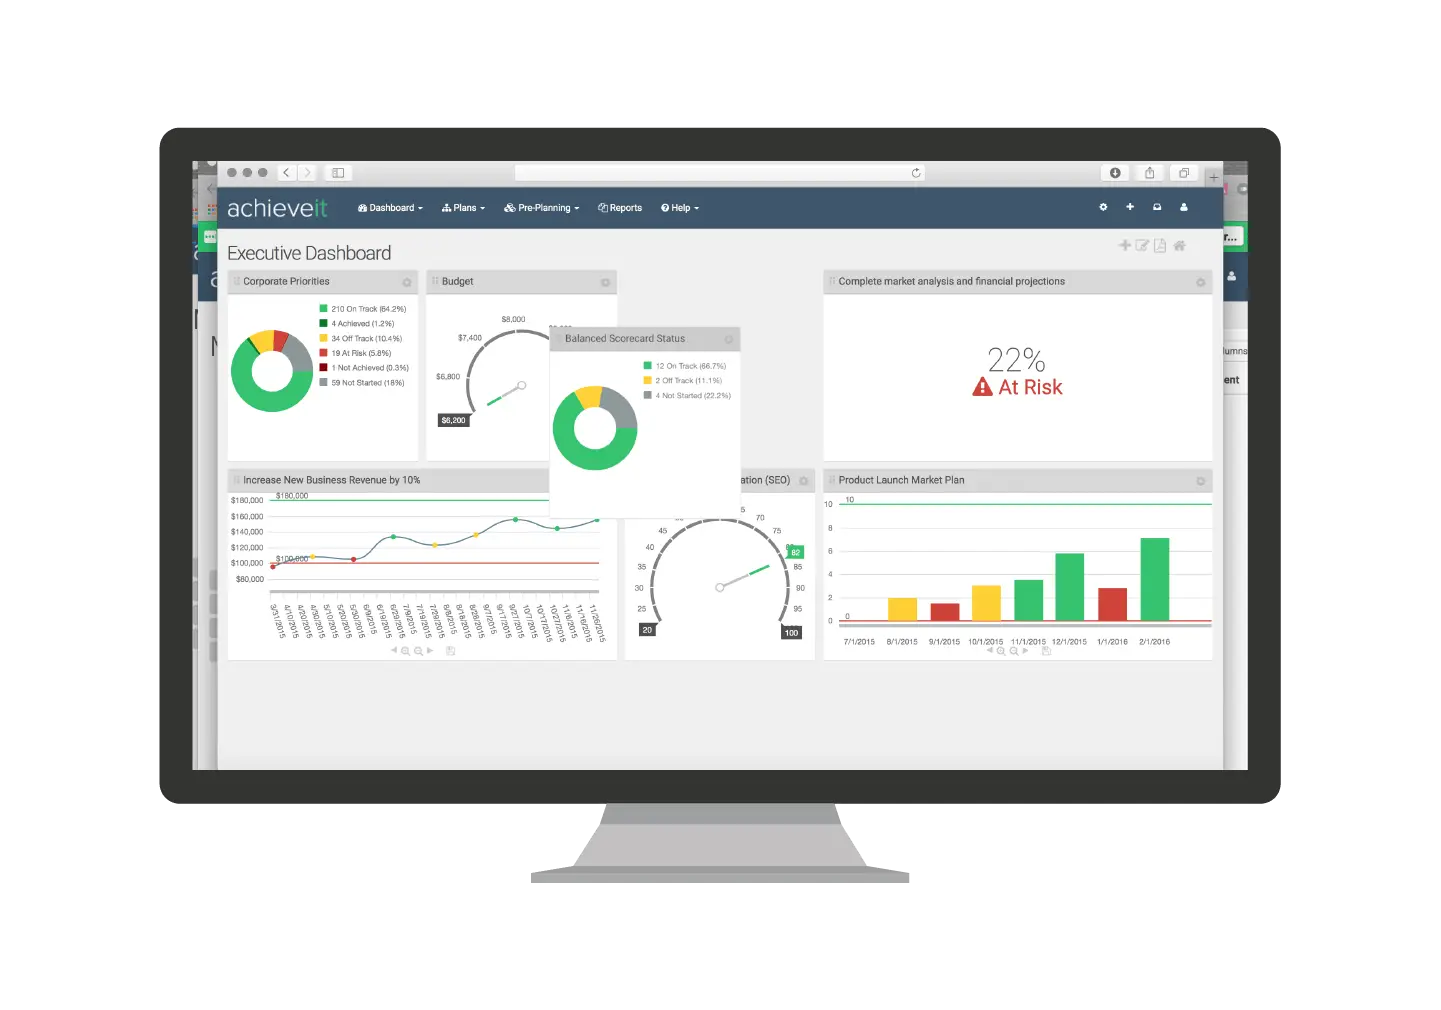
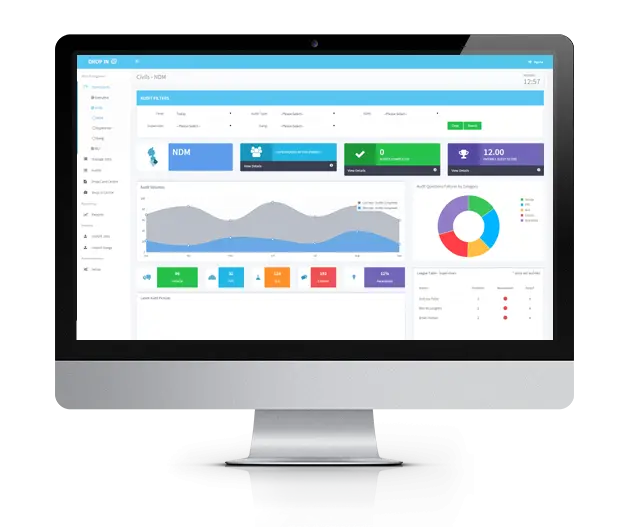
Data Analysis and Dashboard Illustration -

Wheelchair User with Statistical Charts Artwork -
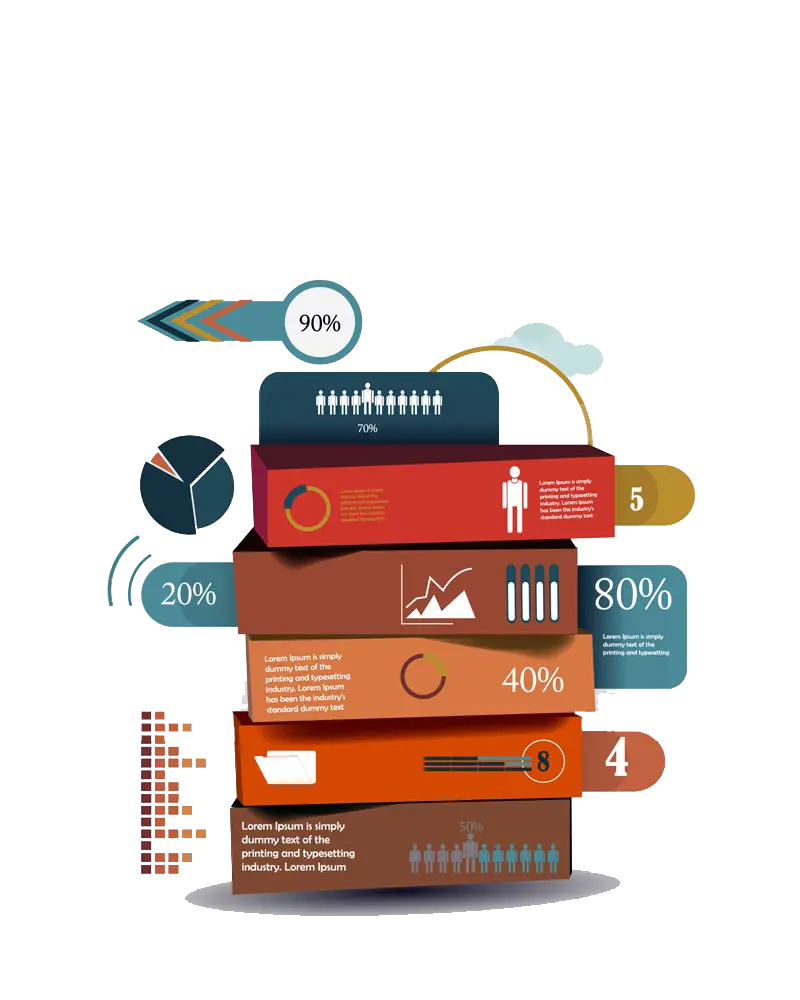
Colorful Infographic with Charts and Statistics -

Upward Trend Icon for Business Analytics -

Analytics Icon with Graph and Magnifying Glass -

Green and Blue Upward Arrow with Bar Graph -
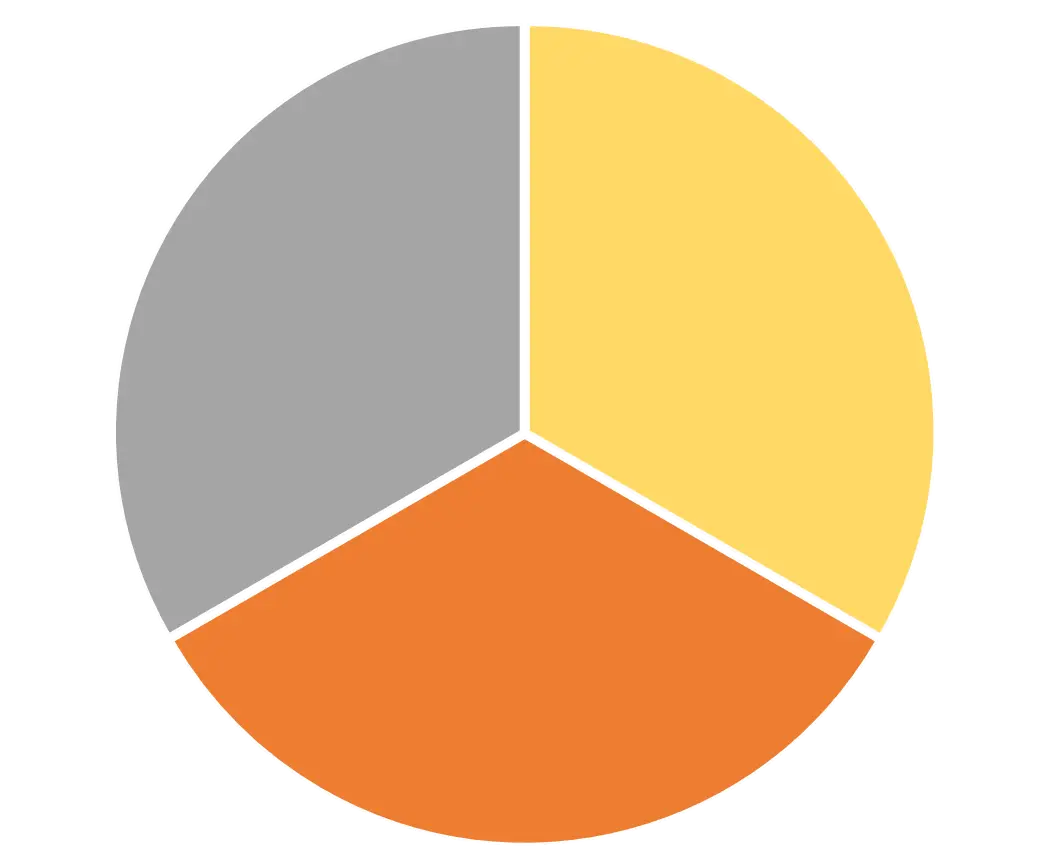
Colorful Pie Chart for Data Representation -
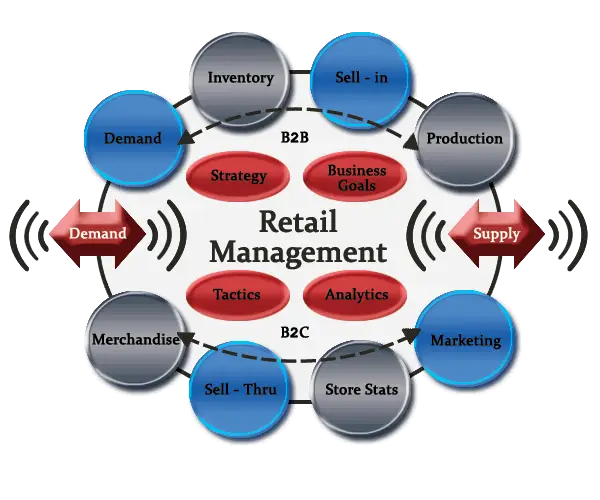
Retail Management Diagram -

Illustration of a Business Meeting in Action -

Laptop with Gears -

Graphs and Charts for Data Analysis