
You Might Like
-

Icon of KPI Dashboard with Graph and Person -

Laptop and Devices with Cloud -

Infographic Pencil with Data Elements -

Digital Devices with Graph -

Calculator and Chart Icon for Data Analysis -

Creation & The Culture Event -

Mobile Data Analysis Graph -

Data Analysis Infographic Design -
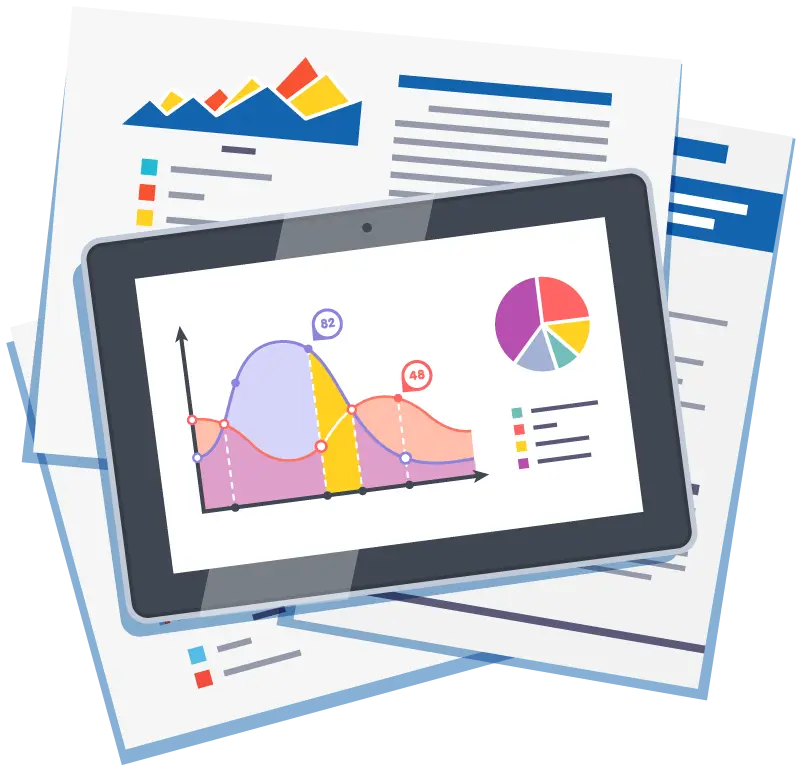
Tablet with Graphs and Data Analysis -

Data Analysis Icon -

Digital Chart and Interactive Graphs on Mobile Device Illustration -

Data Analysis Bar Chart on Monitor -
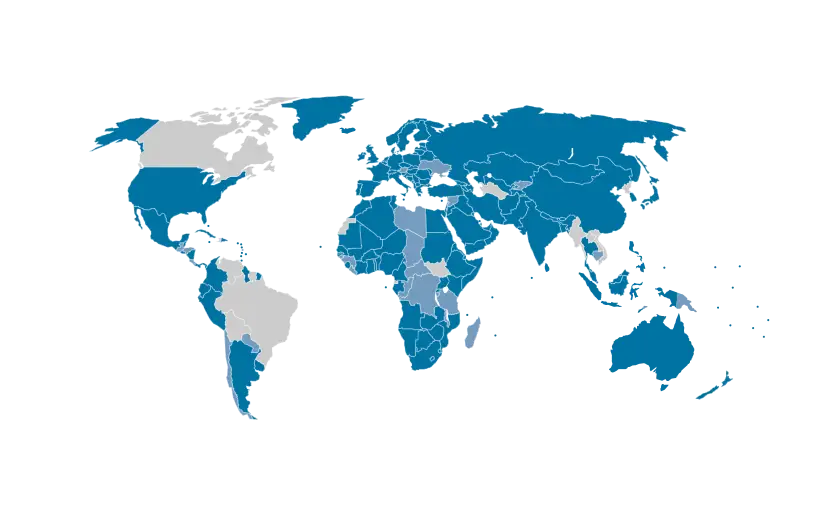
Blue and Gray Editable World Map -
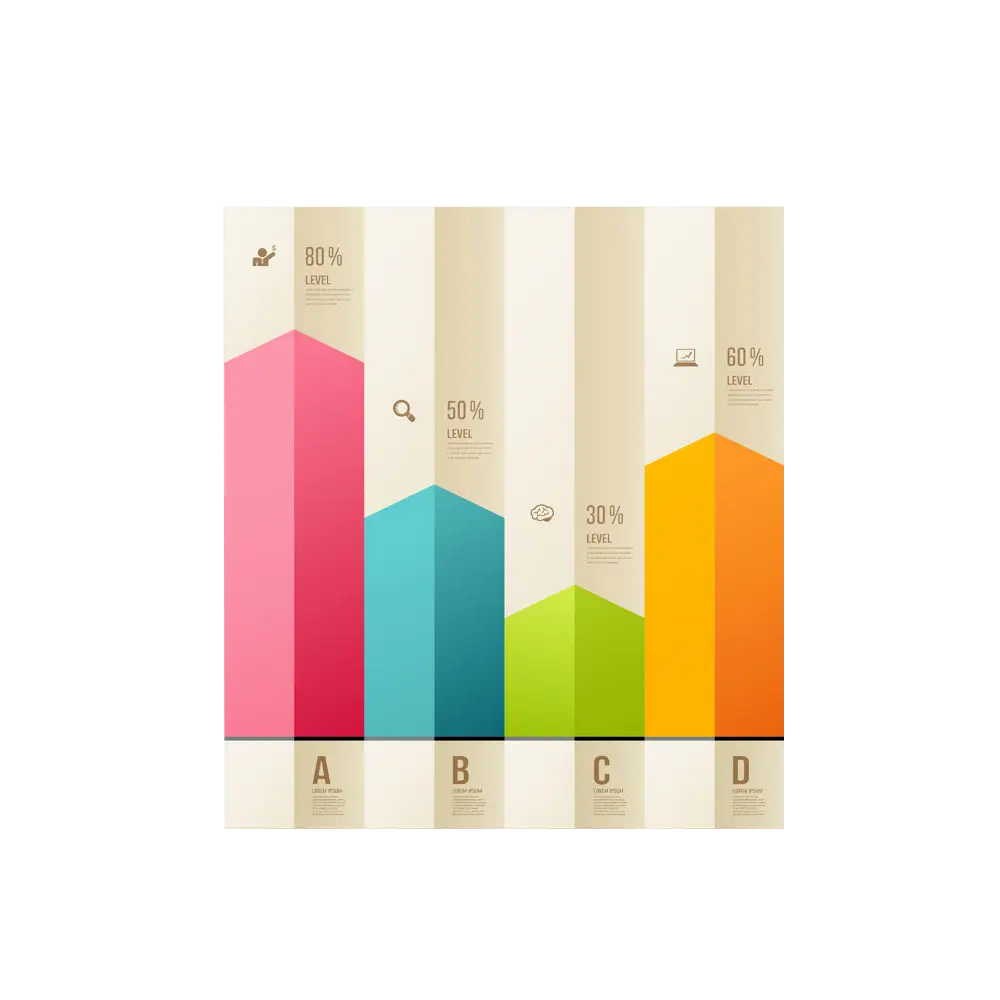
Colorful Bar Chart Infographic -
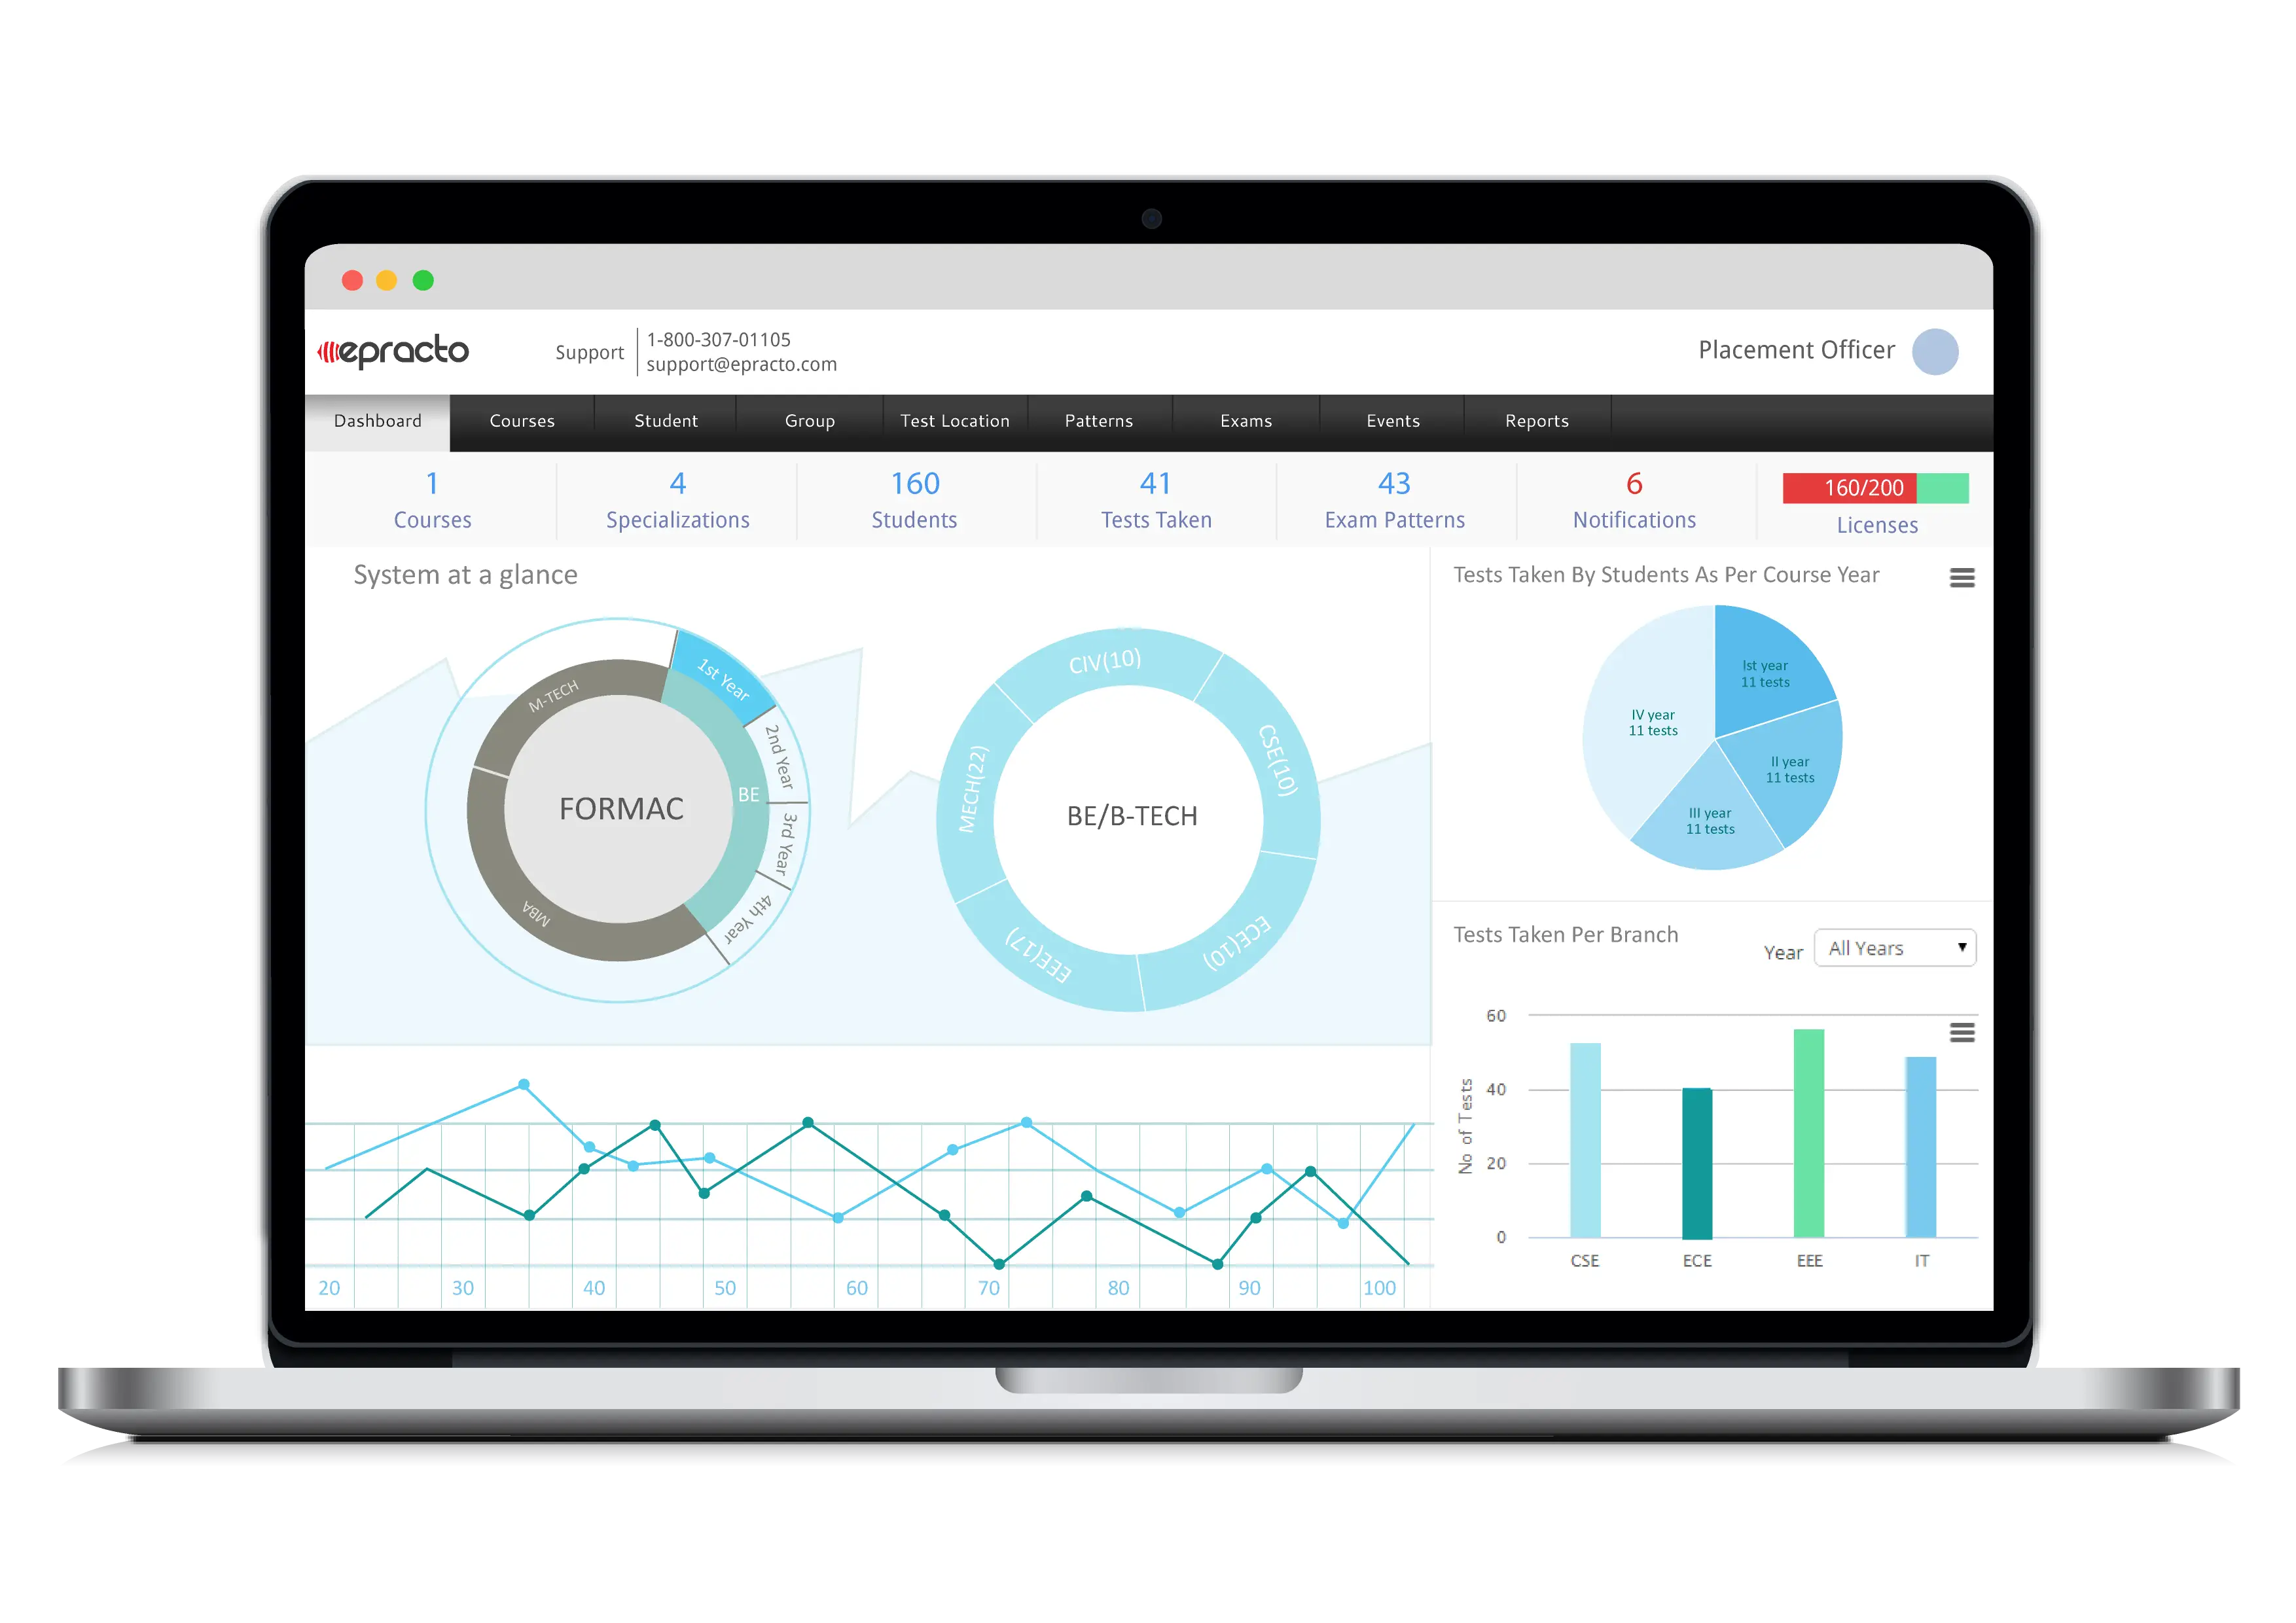
Data Charts on Laptop Screen Business Dashboard -

Businessman Presenting Data on Laptop Illustration -

Analytics Visual Dashboard Illustration -
Trading Monitor with Financial Data Display -
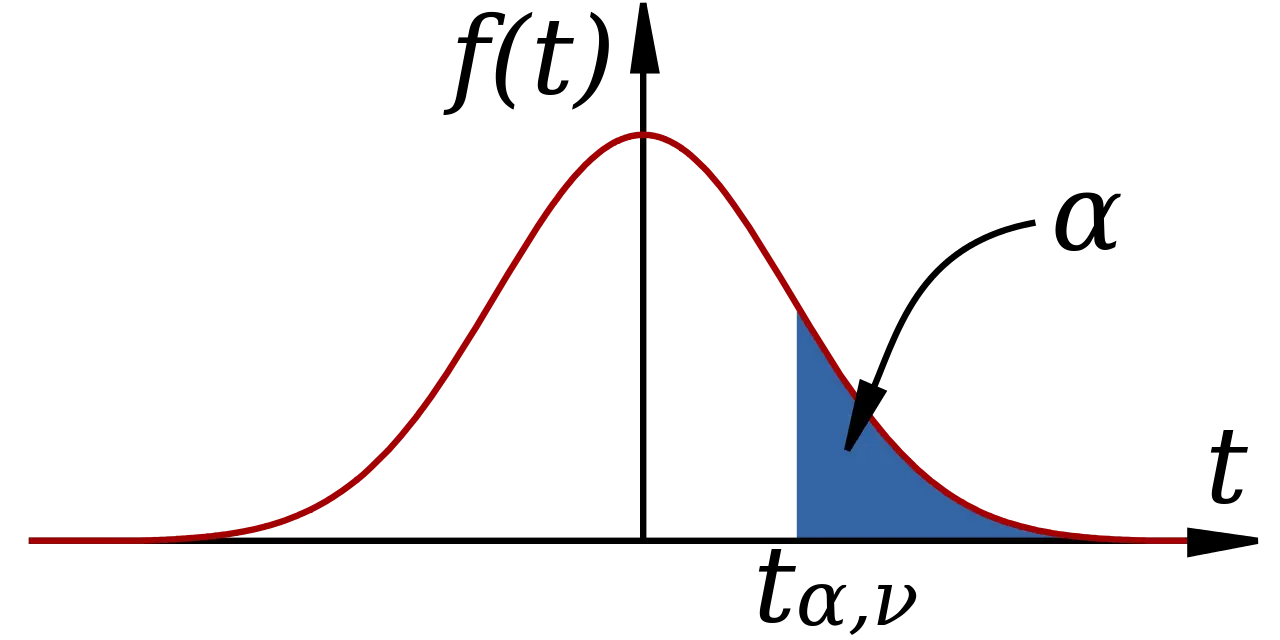
Mathematical Function Graph with Highlighted Area -

Data Analysis on Computer Screen Icon -
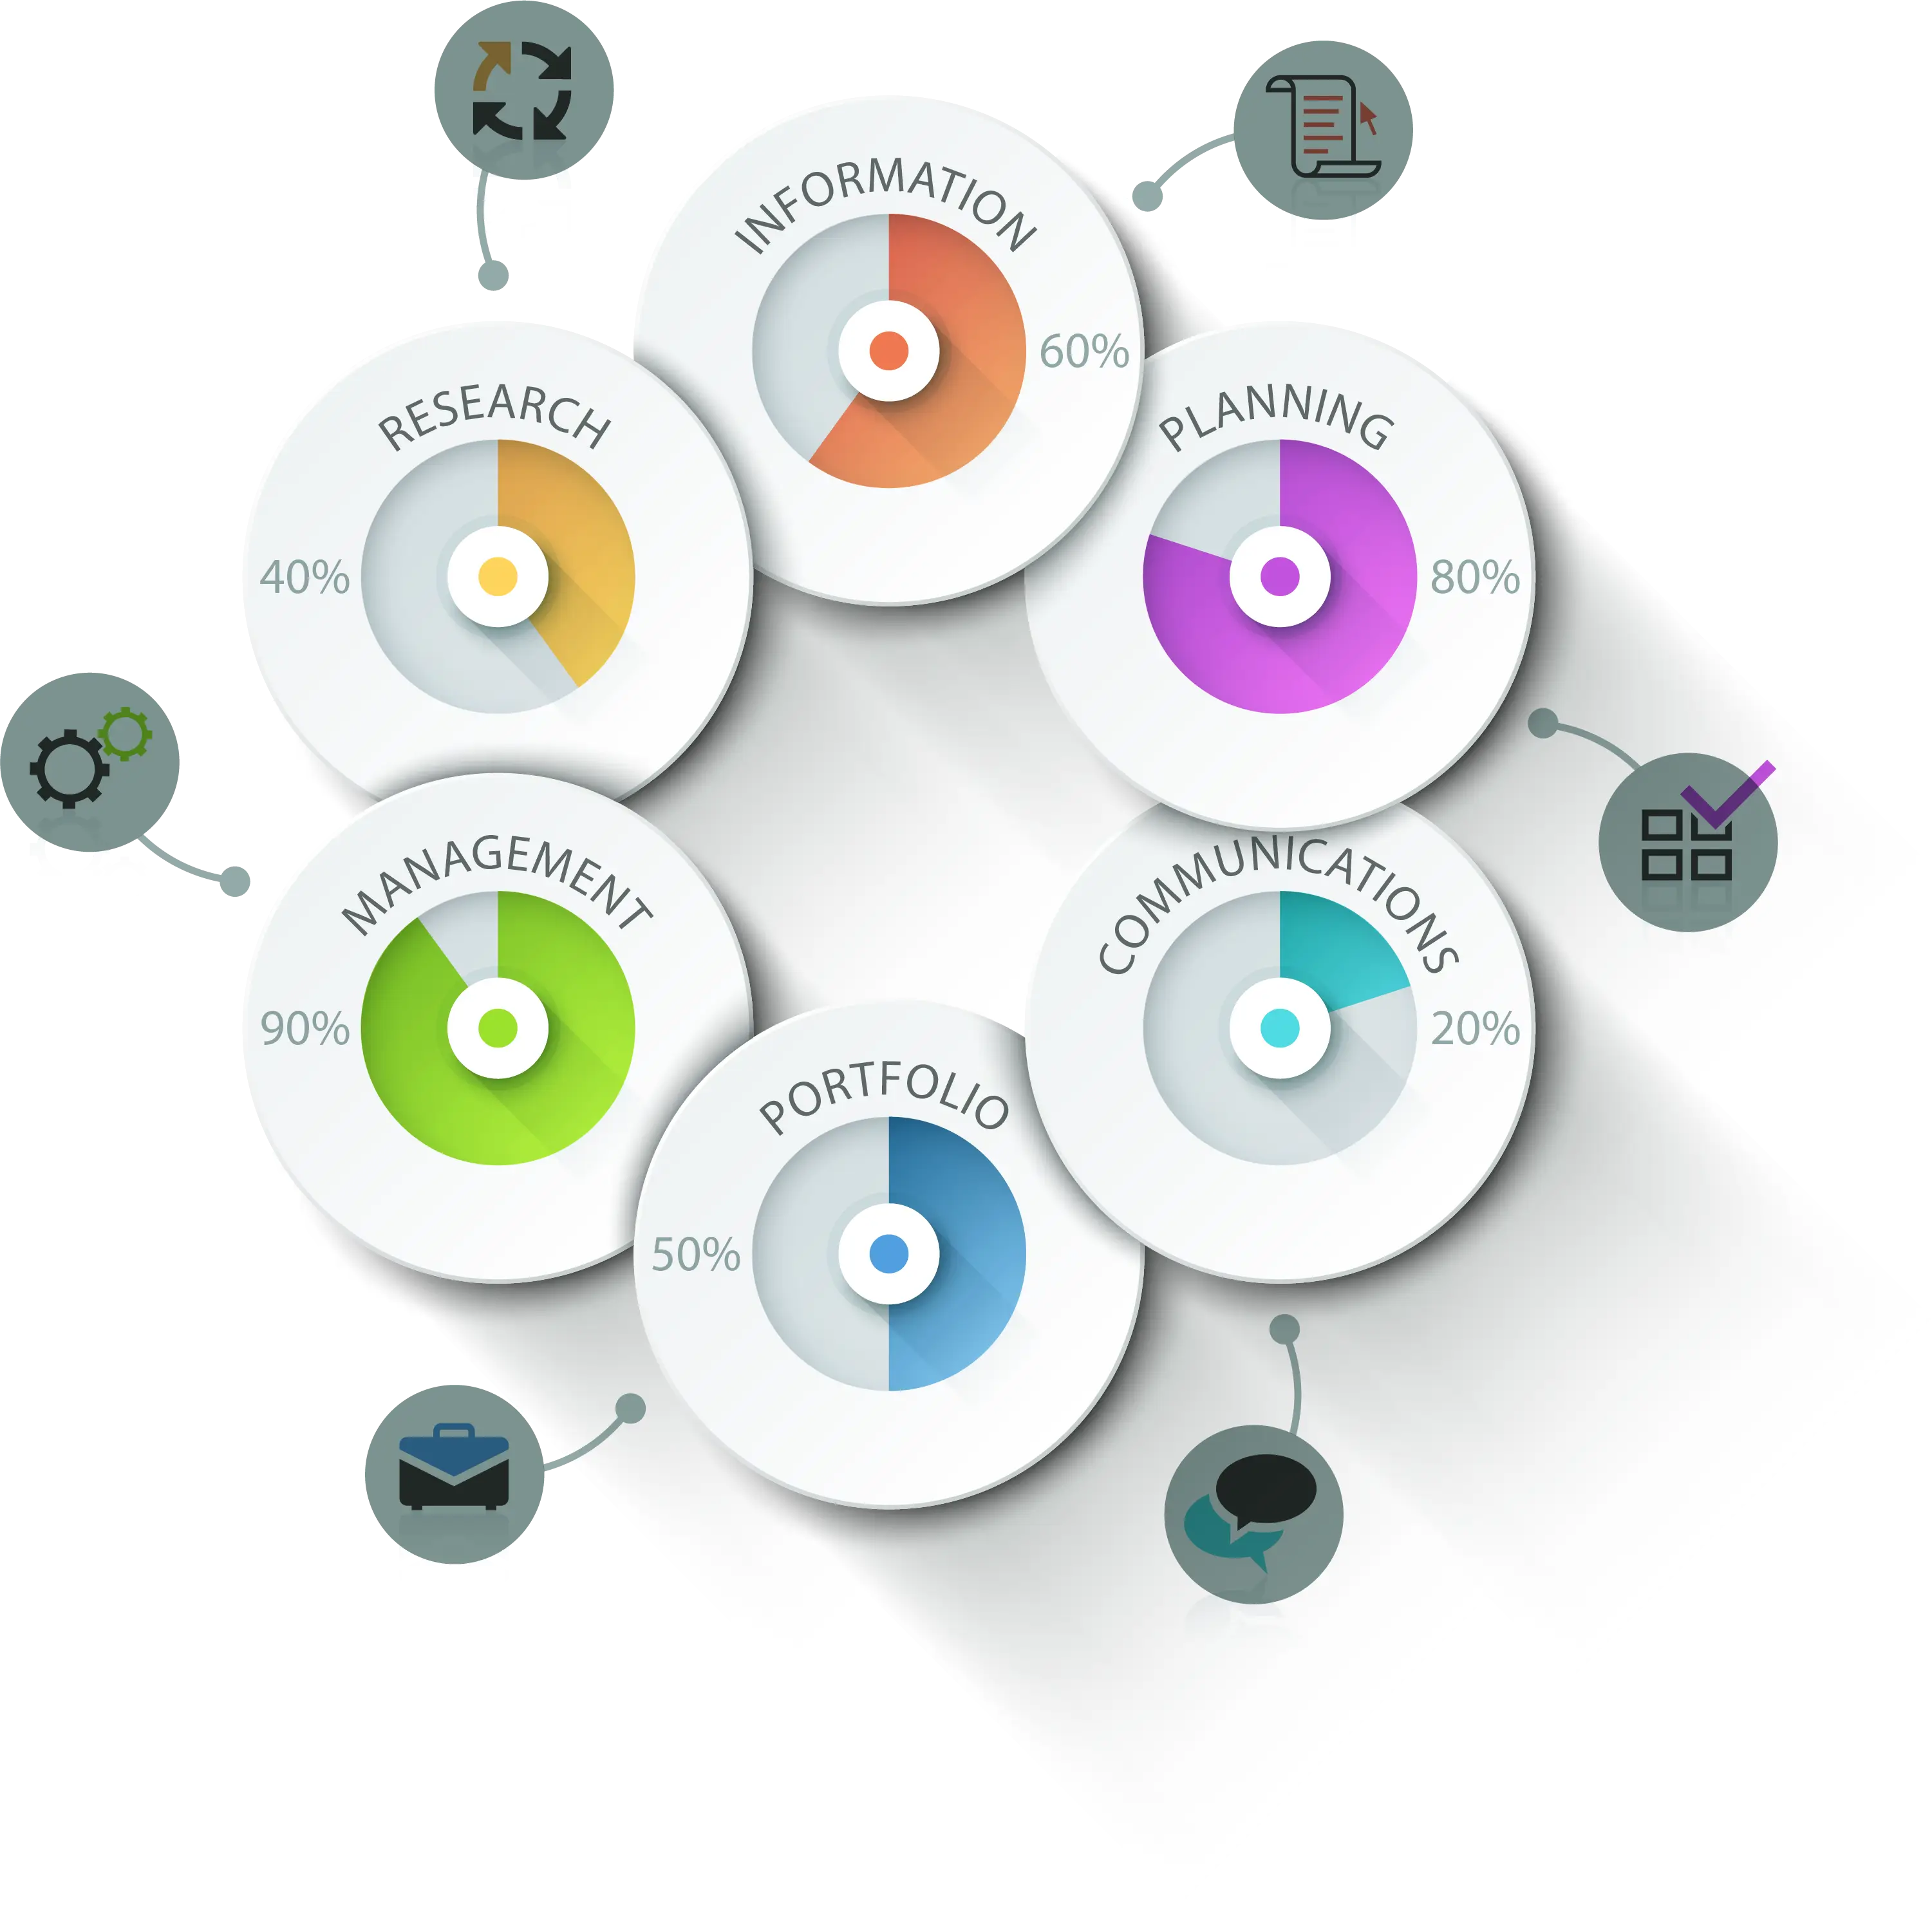
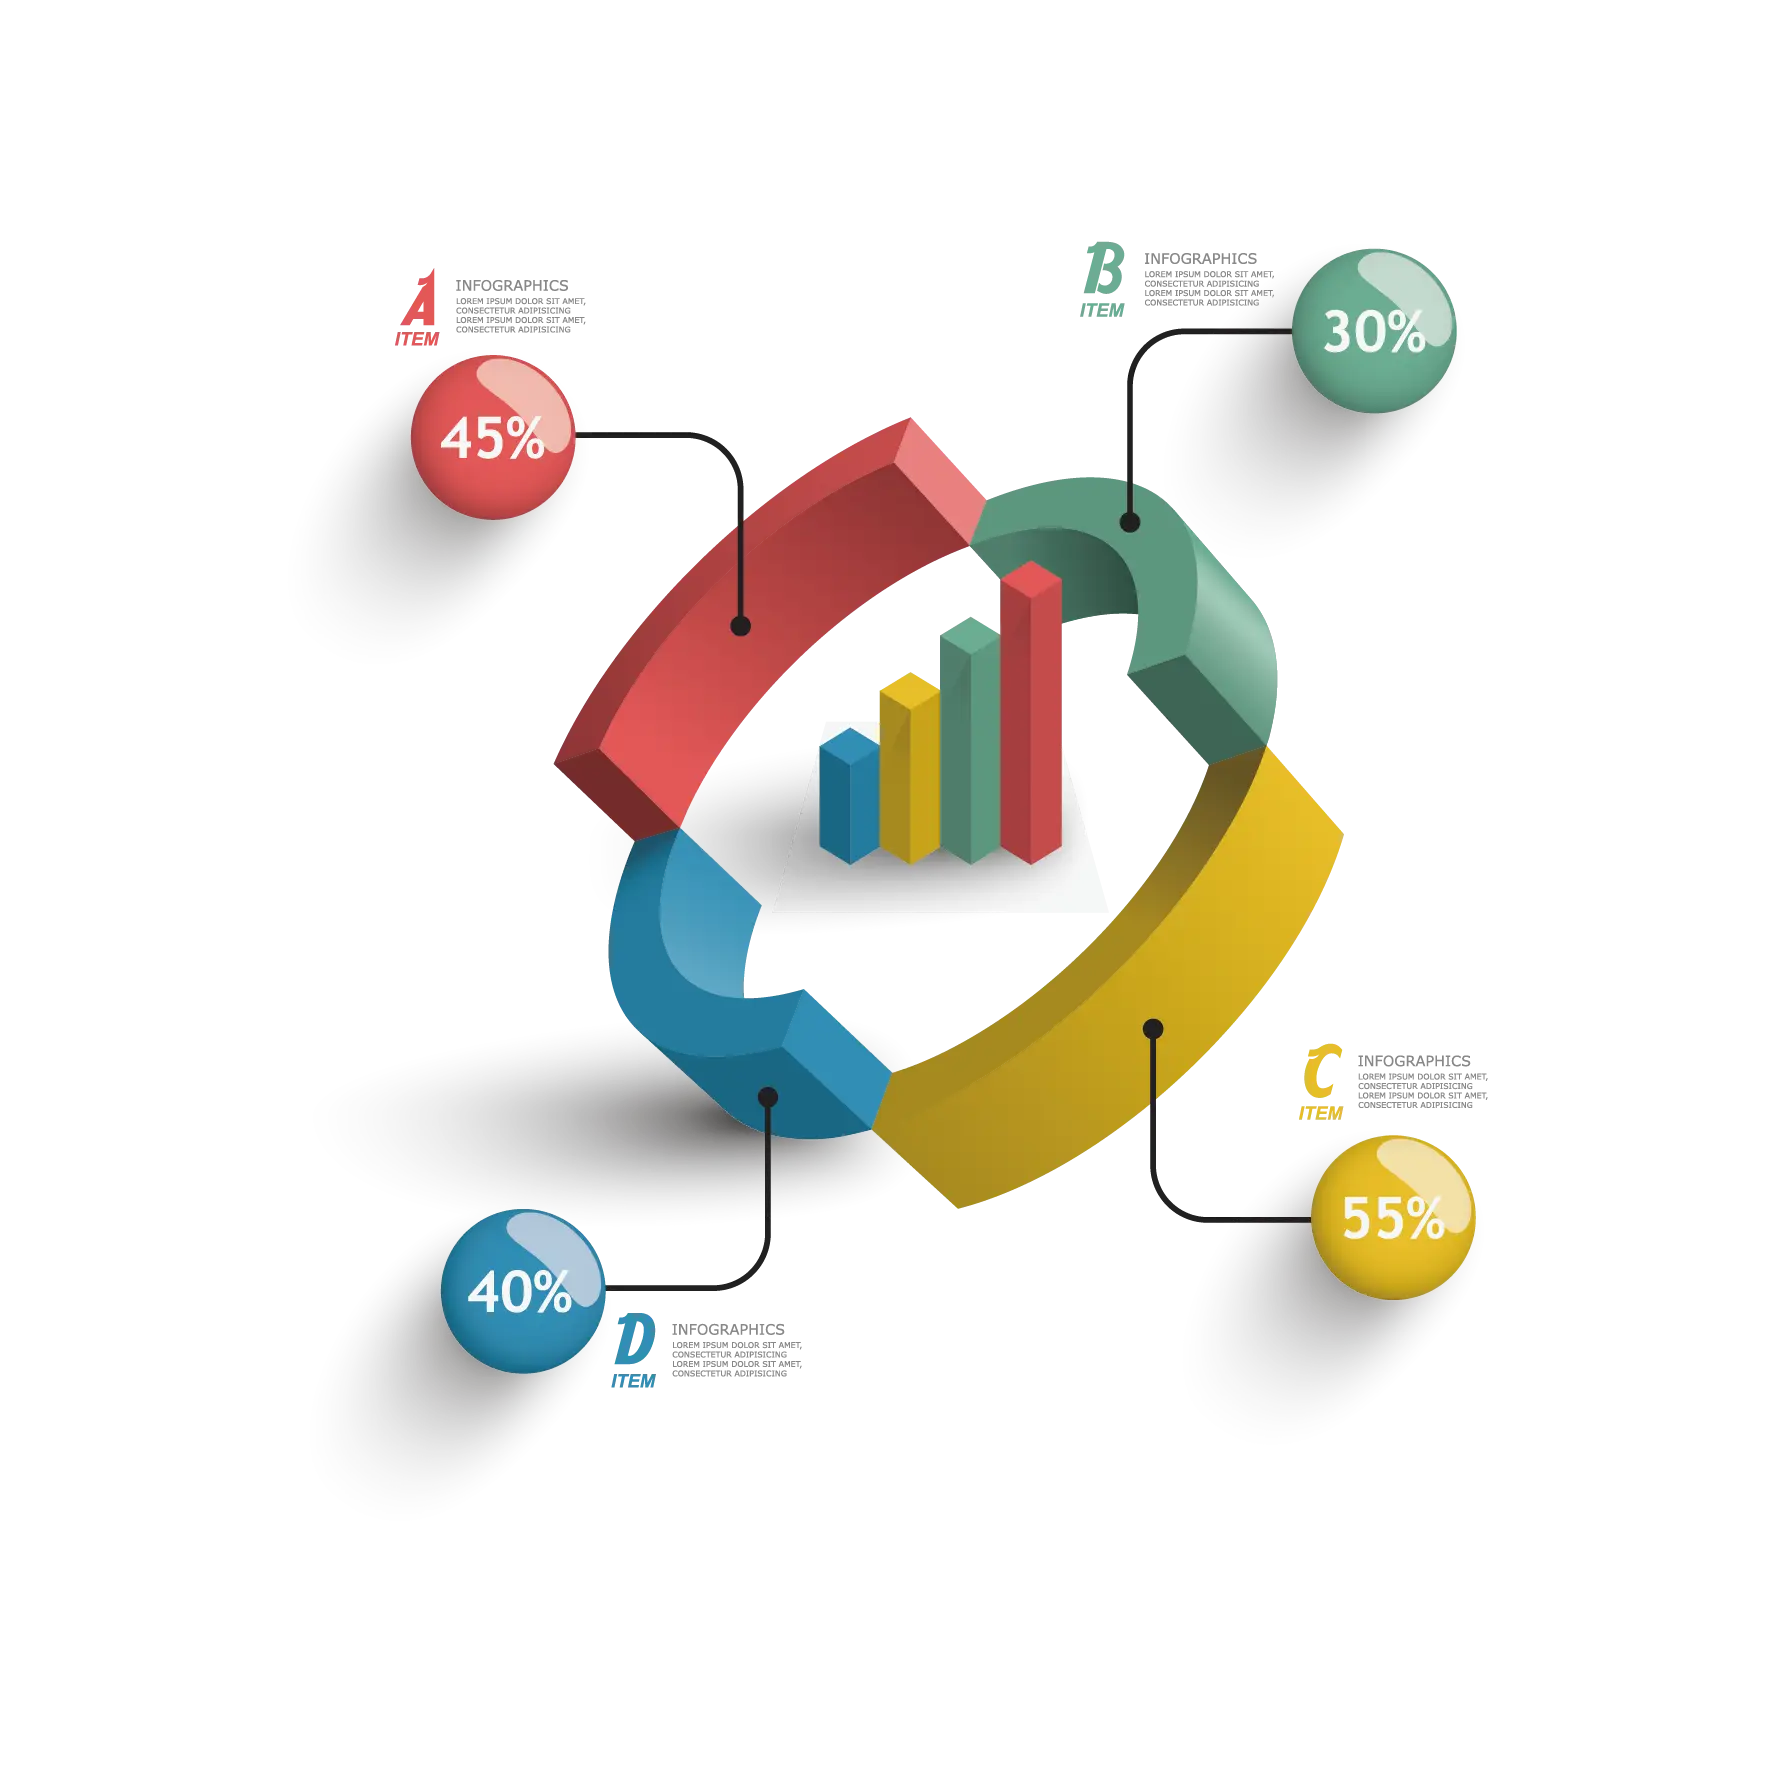
Infographic with Circular Elements -

Hierarchical Structure Diagram -

Complex Network Structure with Interconnected Nodes -

Cloud with Various Technology Icons -
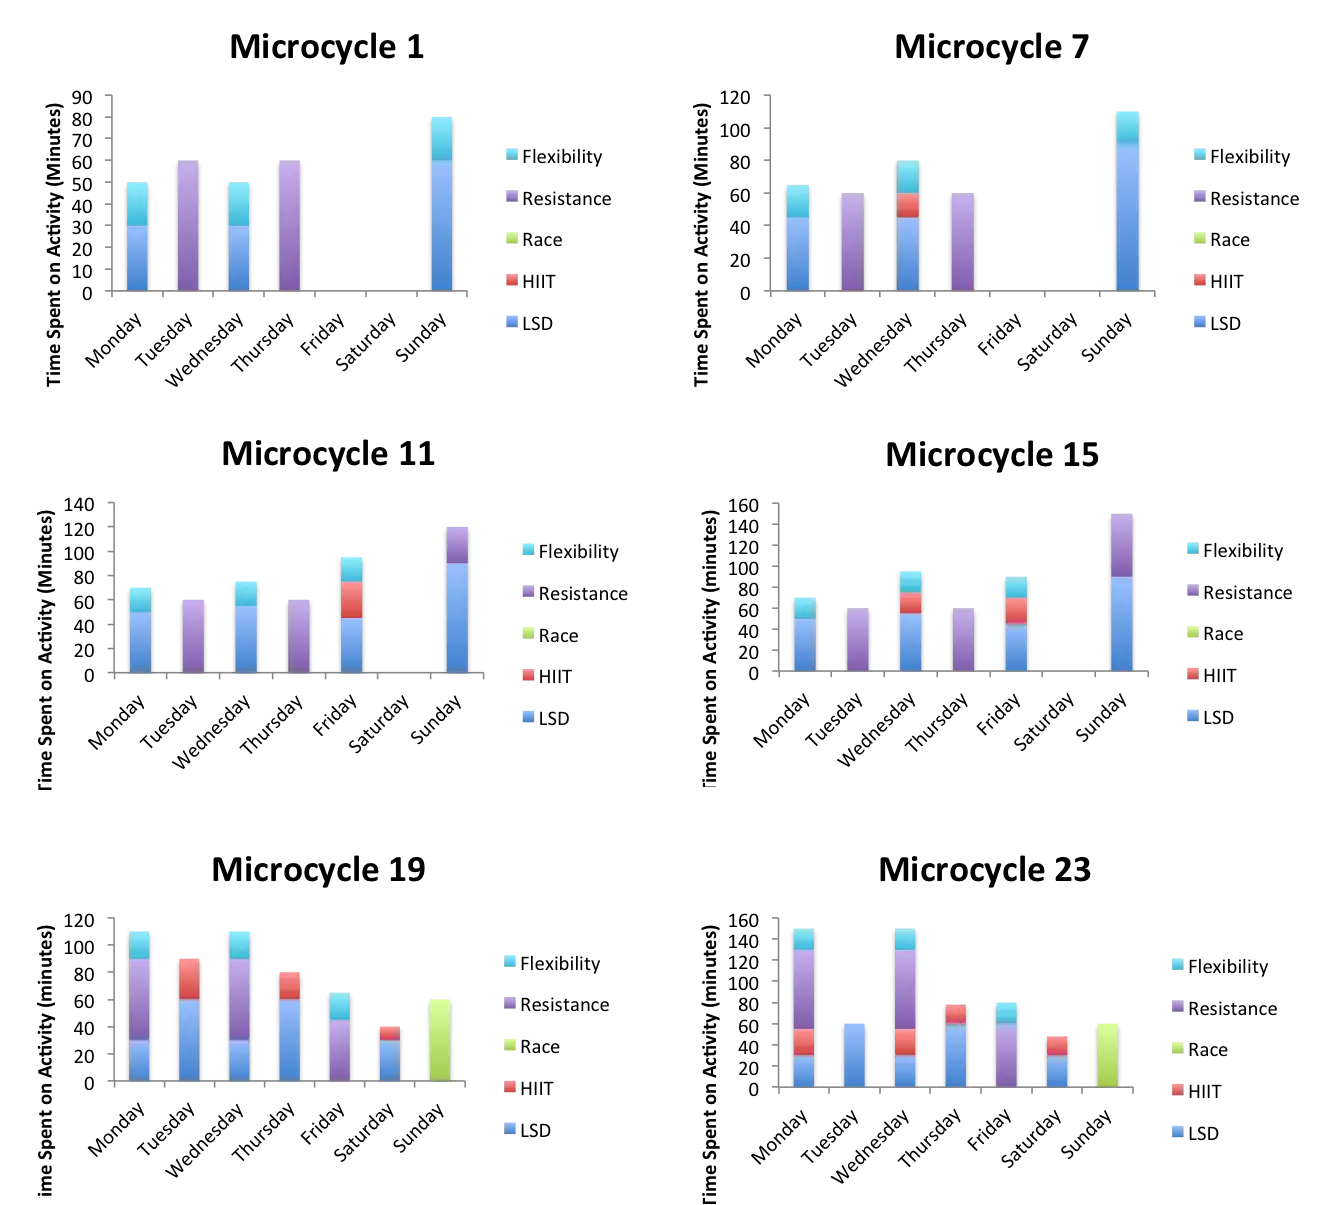
Microcycle Training Charts -
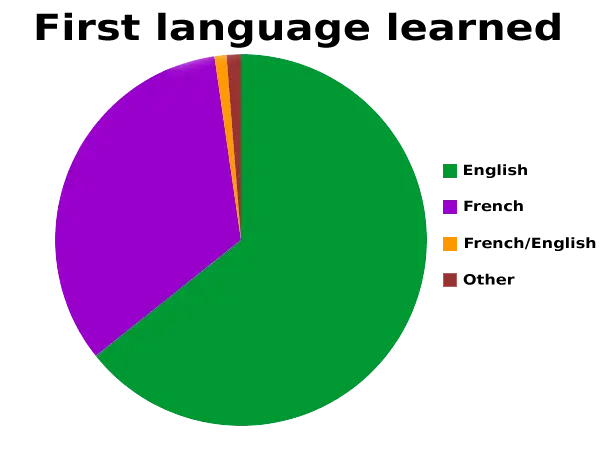
First Language Learned Pie Chart -

Simple Circular Progress Bar Design -
Colorful Infographic Chart -

Simple Pie Chart -

Digital Data Analysis on Multiple Devices